
Figure 1: Participant Exclusion Flowchart.
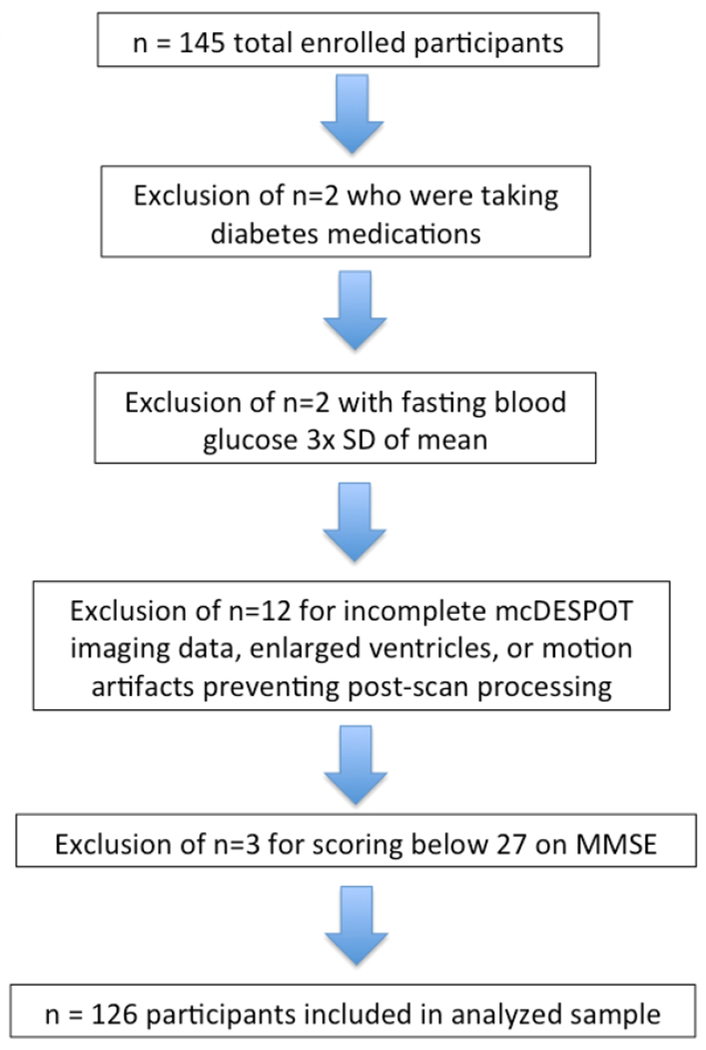
Collected data were screened for exclusionary factors. In particular, two participants were excluded for taking medications for diabetes; two participants were excluded for having fasting blood glucose levels greater than three standard deviations above the mean; and twelve participants were excluded due to incomplete mcDESPOT imaging data, enlarged ventricles, or motion artifacts which prevented post-scan processing.