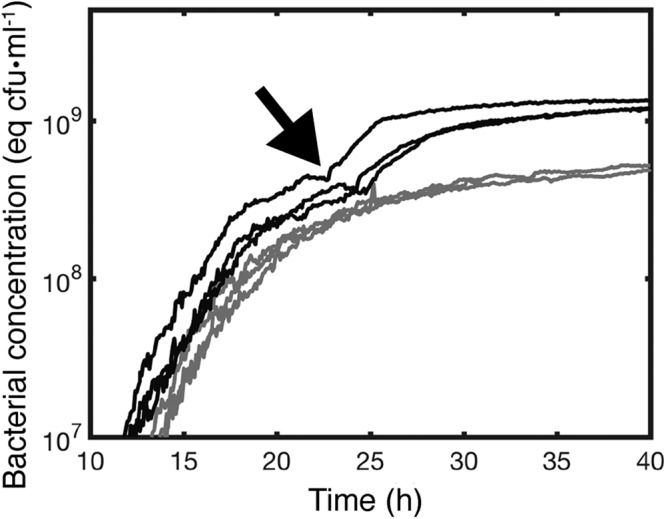
FIG 2.

Production of cellulose maximizes growth in static broth culture. Dynamics of growth of P. fluorescens SBW25 (black lines) and P. fluorescens SBW25 ΔwssA–J (cellulose-negative mutant) (gray lines) in unshaken KB as determined by the scanning laser device and associated photodiode depicted in Fig. 1. Every curve is an independent experiment made in a new flask. Data are the spatial average of the optical density at 600 nm (OD600) obtained from scanning the vertical section of a flask. OD600 measurements are calibrated using direct plate counts of CFU (equivalent CFU · ml−1). Measurements were taken every 5 min. The arrow denotes the onset of bioconvection caused by production of cellulose that marks a secondary increase in growth. This second growth phase is absent in the cellulose-negative mutant.
