FIG 6.

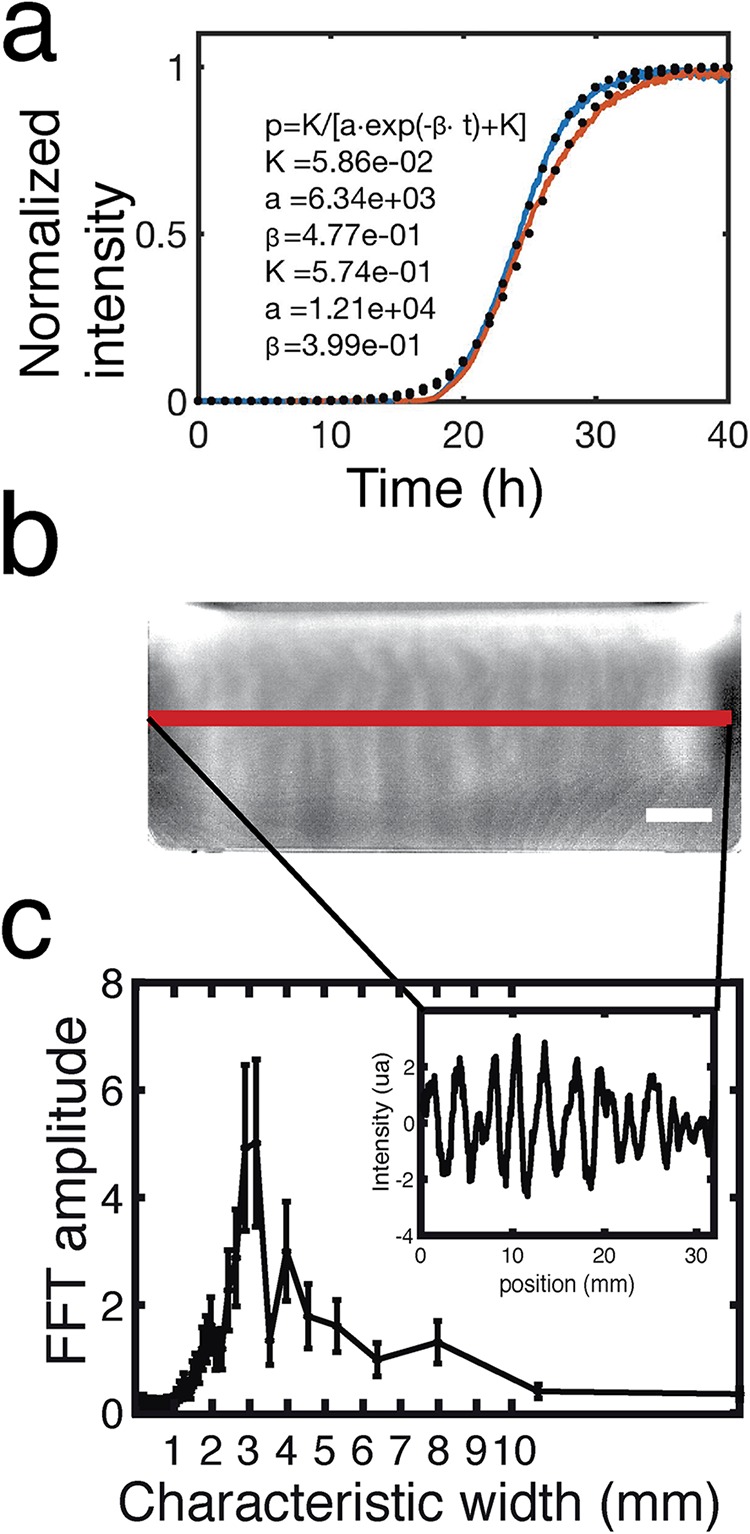
Camera 2 (Fig. 1) monitors the pyoverdin concentration in the flask by measuring fluorescence. Pyoverdin is produced primarily at the ALI. (a) The average fluorescence along the ALI increases with time like a sigmoid curve. The ad hoc logistic function of the inset gives the normalized intensity (p) as a function of the time (t) and the parameters of the fit (K, a, and β). The fitted curves (dotted line) adjust the experimental curves (plain line) for the estimated values of the parameters given in the inset. (b) Plumes due to Rayleigh-Taylor instability transport pyoverdin from the ALI to the liquid phase. The pyoverdin concentration is transiently higher along vertical columns that correspond to the plumes flowing from the ALI. The scale bar is 5 mm. (c) The fluorescence intensity profile along the red line (b) shows that pyoverdin is distributed with a fluctuating spatial structure (inset). Fast Fourier transformation (FFT) of the intensity profile reveals these fluctuations to have a characteristic wavelength of 3 mm.
