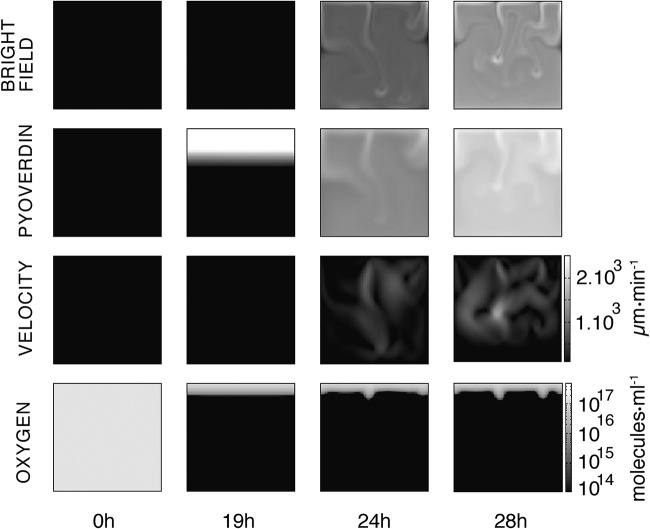
FIG 7.
Numerical simulation of the mathematical model. Images display the dynamics of the simulated microcosm from inoculation at 0 h to 28 h. Time-resolved movies are available in Movies S8 to S11 at figshare (https://figshare.com/projects/Causes_and_consequences_of_cellulose_production_by_Pseudomonas_fluorescens_SBW25_at_the_air-liquid_interface/59630). The first row above shows the dynamics of the biomass in the bulk (bacteria and cellulose) as if observed with bright-field illumination 1 (Fig. 1). In the experiments, at 24 h plumes concentrated in biomass flow are evident in the liquid phase. The second row shows the concentration of pyoverdin in the liquid phase. The plumes transport pyoverdin into the bulk phase. The third row shows the dynamics of liquid velocity. When bioconvection is activated, fluid flow is of the order of 1,000 μm · min−1, which is consistent with the measurements shown (Fig. 5). The fourth row shows the dynamics of oxygen concentration. Soon after inoculation, oxygen in the bulk phase is eliminated due to metabolic (oxygen-consuming) activities of bacteria. The supply of oxygen at the ALI combined with growth of bacteria and production of cellulose means a gradient of oxygen 2 to 3mm into the liquid. Images at 24 and 28 h show oxygen transport from the ALI before consumption by bacteria in the liquid phase. The square images are 1 cm2, and contrast is identical across each row.

