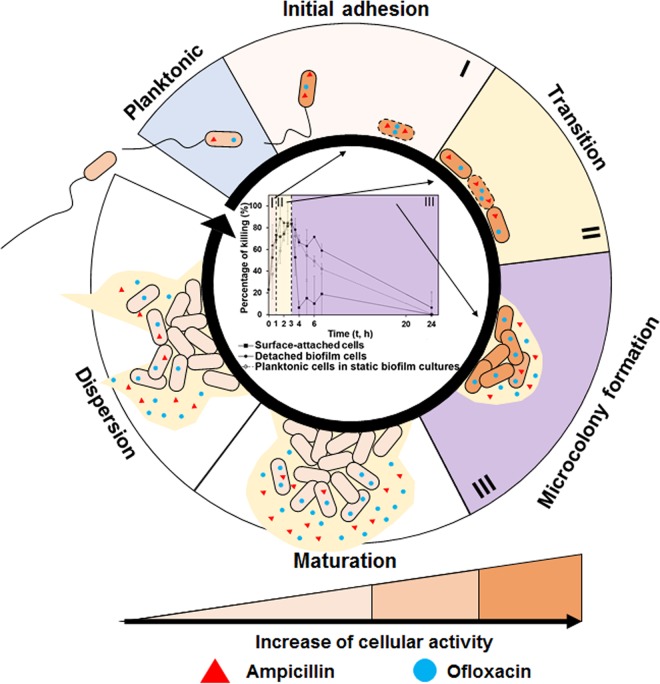
FIG 5.
A hypothetic model of antibiotic susceptibility during early-stage biofilm formation. Phases I, II, and III in this diagram are the main findings from this study. Cells with dotted lines in the cell membrane represent these initially attached cells or cells in interactions with increased membrane permeability. The mechanisms in biofilm maturation and dispersion are based on literature. They are included here to show the whole process of biofilm formation and associated antibiotic tolerance.

