FIG 6.
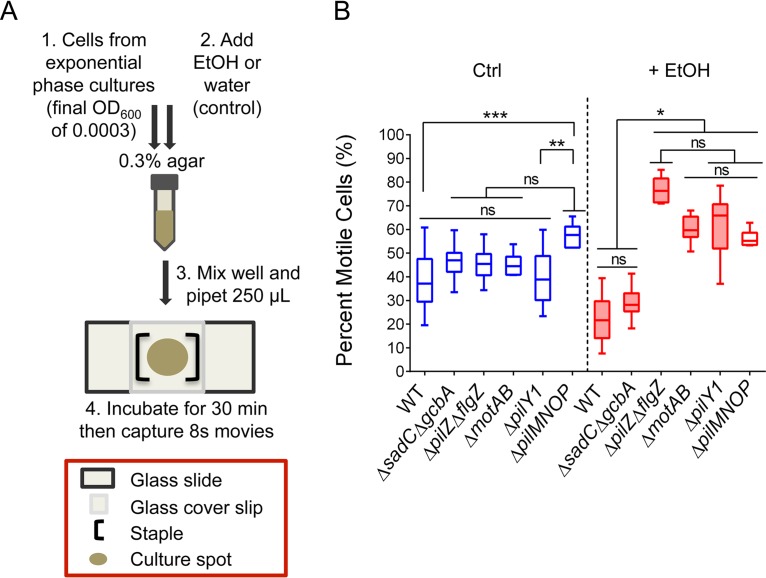
Ethanol decreases the number of continuously motile cells in soft agar, in a manner dependent on MotAB, FlgZ, PilZ, PilY1, and PilMNOP. (A) Schematic of agar motility assay treated with water (control) or 1% ethanol in soft agar. A sample was mixed well, 250 μl was pipetted onto a glass slide, and staples were used to create a chamber using a glass coverslip. The sample was then incubated at room temperature for 30 min and then imaged as outlined in Materials and Methods. (B) Agar motility assay of wild-type P. aeruginosa PA14 (WT) and the ΔsadC ΔgcbA, ΔpilZ ΔflgZ, ΔmotAB, ΔpilY1, and ΔpilMNOP mutants in soft agar without (Ctrl) and with (+ EtOH) 1% ethanol after 30 min. Three time-lapse (8 s) movies of the cells in the agar matrix, for each sample, were captured. Shown is a box and whiskers plot of the average population percentages of the continuously motile subpopulation in each movie. Error bars represent the minimum to maximum data points, n ≥ 6 replicate movies. Shaded boxes represent the ethanol samples that are significantly different from their controls. *, P < 0.05; **, P < 0.01; ***, P < 0.001; ns, not significant as determined by one-way ANOVA with multiple comparisons.

