FIG 2.
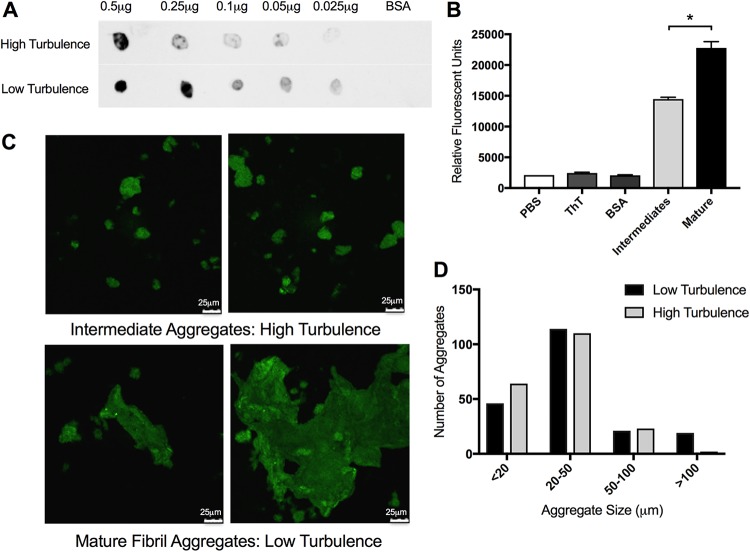
Curli intermediates are detected under high-turbulence growth conditions. (A) Dot blot analysis of decreasing concentrations of curli purified from high-turbulence and low-turbulence cultures was completed on PVDF membrane. BSA was used as a negative control. Blots were imaged on the Li-Cor Odyssey imaging system. (B) Aliquots of purified curli aggregates (400 μg/ml) from high-turbulence and low-turbulence growth conditions were stained with 10 μM ThT and quantified after a 10-min incubation at room temperature on a fluorescent plate reader at excitation 440 nm/emission 500 nm. Data are means (±standard error of the mean [SEM]) from three replicates. *, P < 0.05. (C) Curli purified from high-turbulence (left panel) and low-turbulence (right panel) growth conditions stained with 10 μM thioflavin T were imaged at ×60 magnification by confocal microscopy. Scale bars are 25 μm. (D) Enumeration of difference in size of aggregates calculated by confocal microscopy images. Aggregates were measured within the LAS AF confocal system and grouped into one of four groups. Two hundred aggregates were counted for each condition.

