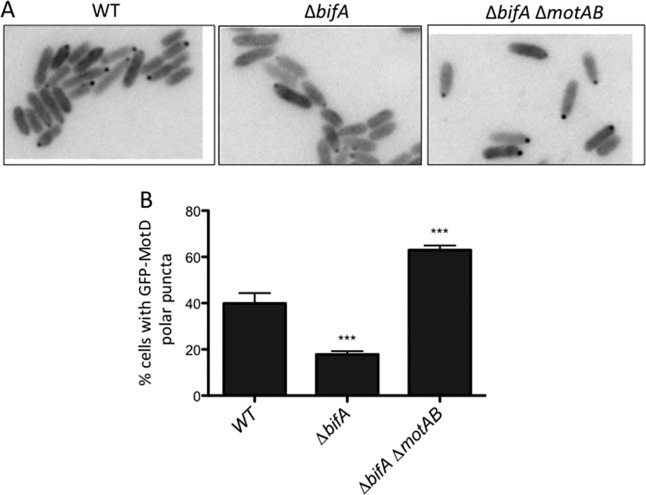
FIG 1.
Localization of GFP-MotD is impacted by MotAB. (A) Representative fluorescence microscopy images of the indicated strains expressing GFP-MotD from the chromosome. Grayscale images were inverted using ImageJ. (B) Percentages of cells with GFP-MotD polar puncta for the indicated strains expressing GFP-MotD. These data are from two independent experiments, with at least 200 total cells counted per strain per experiment. Values are reported as means ± standard errors of the means (SEM). Significance was determined by analysis of variance and Dunnett’s posttest for comparison for differences relative to the WT. ***, P < 0.001.

