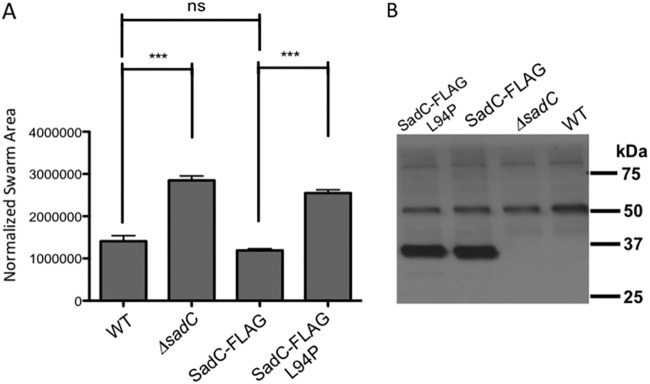
FIG 6.
Analysis of SadC point mutations in P. aeruginosa. (A) Swarming motility as assessed for the indicated strains. Significance was determined by analysis of variance and Tukey’s post hoc test comparison for differences from the WT or the SadC-FLAG expression strain swarm zone, as indicated. ***, P < 0.0001; ns, not significant. (B) Western blot analysis of the WT and mutant FLAG-tagged SadC. The positions of the molecular weight size standards are shown on the right. The bands at ∼50 and ∼80 kDa are nonspecific, cross-reacting bands and serve as additional loading controls. Each lane contains 250 μg of crude cell extract of the P. aeruginosa carrying the indicated allele of the SadC or SadC-FLAG gene.

