FIG 4.
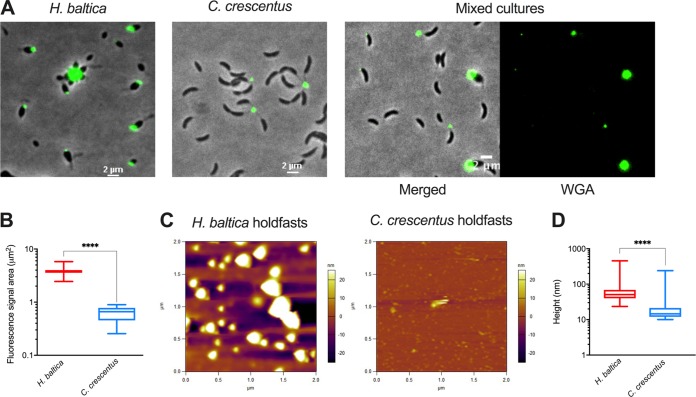
H. baltica produces large holdfasts. (A) Images of H. baltica, C. crescentus, and mixed culture with holdfasts labeled with WGA-AF488 (green). (B) Quantification of holdfast size based on WGA-AF488 fluorescence area. The data in the box-and-whisker plots represent 5 independent replicates of 200 holdfasts from each strain. The variance between H. baltica and C. crescentus holdfast fluorescent areas was analyzed using a t test. ****, P < 0.0001. (C) AFM images of dry shed holdfasts from H. baltica ΔhfaB and C. crescentus ΔhfaB deposited on a mica surface. The colors on the scale represent the height of the holdfast relative to the surface. (D) Box-and-whisker plots of holdfast height distribution from AFM images. More than 500 holdfasts were measured in 10 independent images. The variance between H. baltica and C. crescentus holdfast heights was analyzed using a t test. ****, P < 0.0001.

