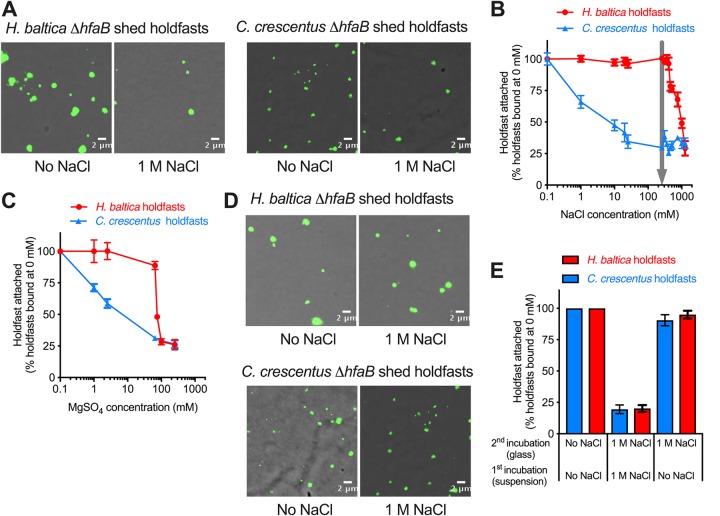
FIG 7.
H. baltica holdfasts tolerate higher ionic strength than C. crescentus holdfasts. (A) Images of WGA-AF488-labeled H. baltica ΔhfaB and C. crescentus ΔhfaB shed holdfasts bound to glass slides and incubated in different concentration of NaCl for 4 h. (B) Percentages of holdfasts bound per field of view at different concentrations of NaCl. The number of holdfasts bound per field of view at 0 M NaCl was standardized to 100%. The arrow indicates the ionic strength of marine broth and the Baltic Sea (250 mM), from which H. baltica was isolated. The data are expressed as averages from 6 independent replicates, and the error bars represent the standard errors. (C) Percentages of holdfasts bound per field of view at different concentrations of MgSO4. The number of holdfasts bound per field of view at 0 M MgSO4 was standardized to 100%. The data are expressed as averages from 4 independent replicates, and the error bars represent the standard errors. (D) Images of WGA-AF488-labeled holdfasts already bound to a glass surface and incubated in 0 mM NaCl and 1 M NaCl for 12 h. (E) Percentages of holdfasts bound per field of view at 0 M or 1 M NaCl. The first incubation was done by adding 0 M or 1 M NaCl to a holdfast suspension spotted on a glass slide. After a 12 h of incubation, the second incubation was done, after washing off unbound holdfasts, by adding 0 M or 1 M NaCl directly to the holdfasts attached to the glass slide and incubating them for another 12 h. The number of holdfasts bound per field of view at 0 M NaCl was standardized to 100%. The data are expressed as averages from 5 independent replicates, and the error bars represent the standard errors.

