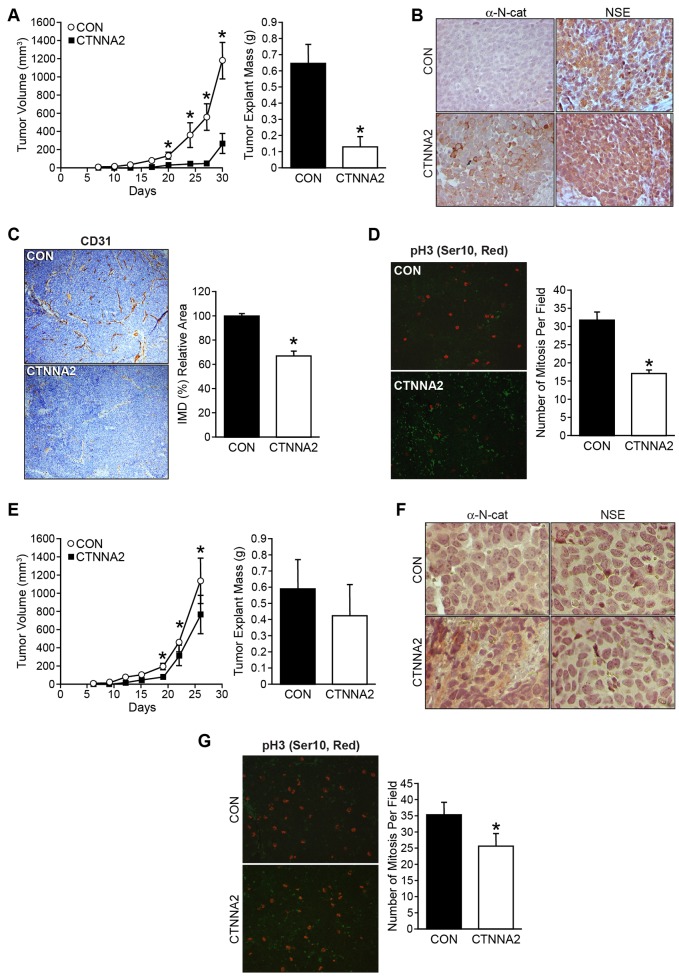
Figure 4. α-N-catenin inhibits tumor growth in tumor xenograft mouse model.
(A) Mouse subcutaneous xenografts were established with SK-N-AS cells stably transfected with a control vector (CON) and CTNNA2 overexpression vectors in each flank side of the mouse (n = 10, Left). Tumor volume was measured biweekly. Tumor explant weights were obtained at the time of sacrifice at day 30 (Right). (B) Expression of α-N-catenin and NSE were detected by immunohistochemistry in tumor tissues from SK-N-AS xenografts. (C) Representative microphotographs of CD31 expression in SK-N-AS xenografts from control- or CTNNA2 overexpressed mice. CD31 was immunohistochemically stained with anti-human CD31 antibody (brown); magnification 100 ×. Intratumoral microvessel density was assessed by quantifying endothelial cells, using CD31-stained sections. (D) Mitotic cells were quantified by counting positive immunohistochemical stained phospho-Histone H3 (red) cells in paraffin-embedded sections from SK-N-AS xenografts. (E) Mouse subcutaneous xenografts were established with BE(2)-C cells stably transfected with a control vector (CON) and CTNNA2 overexpression vectors in each flank side of the mouse (n = 10, Left). Tumor volume was measured biweekly. Tumor explant weights were obtained at the time of sacrifice at day 26 (Right). (F) Expression of α-N-catenin and NSE were detected by immunohistochemical staining in tumor tissues from BE(2)-C xenografts. (G) Mitotic cells were quantified by counting positive immunohistochemical stained phospho-Histone H3 (red) cells in paraffin-embedded sections from BE(2)-C xenografts. Data represent mean ± SEM; * = p < 0.05 vs. CON.

