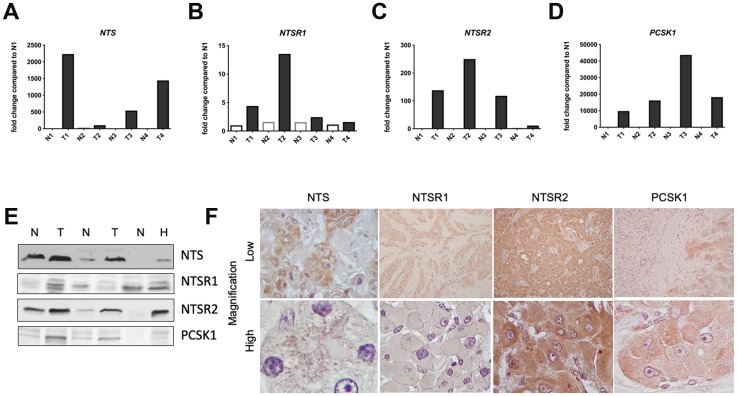
Figure 1. Neurotensin pathway mRNA and protein expression in FL-HCC.
Relative transcript expression levels of genes expressing neurotensin (NTS, A), neurotensin receptor types 1 (NTSR1, B) and 2 (NTSR2, C), and PCSK1 (panel D) in FL-HCCs (T) versus paired, normal liver (N). (E) Immunoblotting demonstrates expression of NTS, NTSR1, NTSR2, and PCSK1 proteins in FL-HCCs (T) vs normal livers (N). HepG2 cells (H) were use as positive controls. (F) Low (10x) and high (100x) power magnification of FL-HCCs following immunohistochemical staining for NTS, NTSR1, NTSR2, or PCSK1.

