Fig. 5.
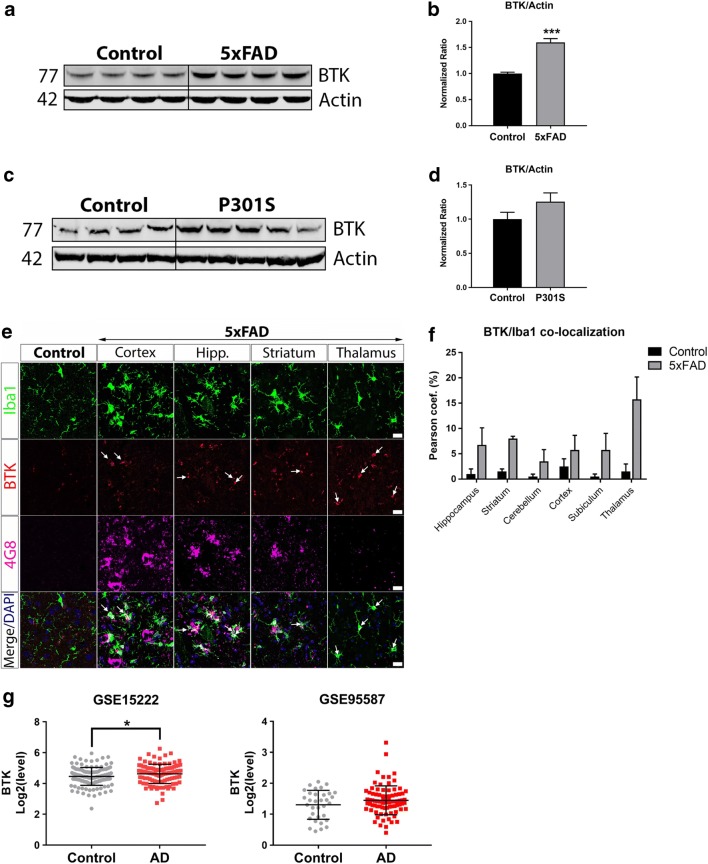
Elevated BTK levels in brains of 5xFAD mice and AD patients. a Western blot of protein lysates isolated from brains of 5xFAD mice and littermate controls. b Quantification and normalization of BTK levels to actin loading control shows significantly increased BTK in 5xFAD brains. Data presented as mean ± s.e.m., n = 4 animals per group, unpaired t-test, ***p < 0.001 versus littermate control. c Western blot of protein lysates isolated from cortical brain tissue of P301S mice and littermate controls. d Quantification and normalization of BTK levels to actin loading control shows a non-significant increase in BTK levels in P301S brains. Data presented as mean ± s.e.m., n = 4–5 animals per group, unpaired t-test. e Representative confocal microscopy images of BTK immunoreactivity in Iba1-positive microglia in control brains and in indicated regions of 5xFAD mouse brains showing Aβ (4G8) immunoreactivity. Scale bar = 20 μm. f BTK/Iba1 co-localization analysis showed increased microglial BTK levels in multiple brain regions of 5xFAD mice compared to littermate controls. Data presented as mean ± s.e.m., n = 4 animals per group. g BTK transcript levels in two previously published gene expression datasets from AD patient brain bulk tissues (GSE15222: temporal cortex, GSE95587: fusiform gyrus). BTK levels were modestly elevated in AD patients in both datasets with a significant increase of BTK in dataset GSE15222. Data presented as mean ± s.d., unpaired t-test, *p < 0.05

