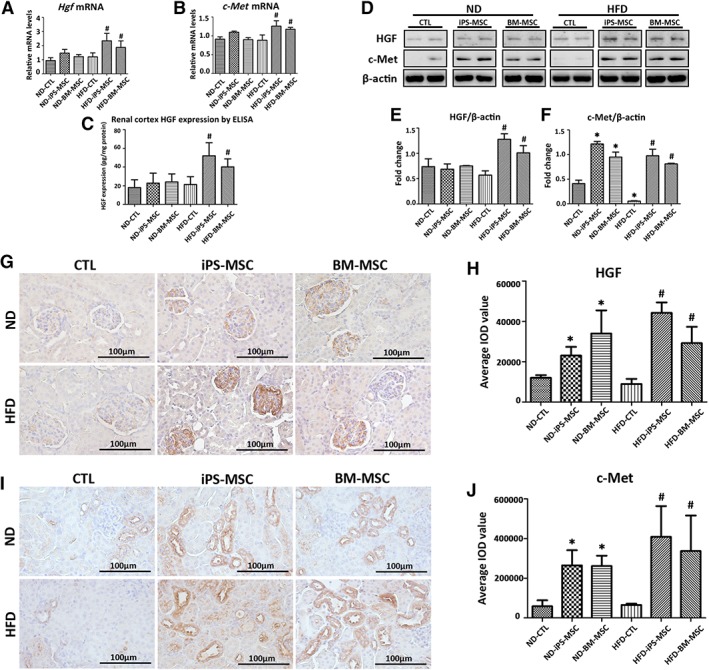
Figure 5.

MSCs infusion augments HGF/c‐Met paracrine signaling in obese kidney microenvironment. (A, B): Hgf and c‐Met mRNA expression in mice kidneys were determined by qPCR. Data expressed as fold change relative to CTL. (C): HGF concentration in total renal cortex protein lysatesas measured by ELISA. (D): Representative Western blots for HGF and c‐Met are shown, with (E, F) quantification of each protein normalized to β‐actin. Representative micropraphs from immunohistochemistry staining of (G) HGF and (I) c‐Met in kidney sections of mice, with semiquantification of average IOD value for (H) HGF and (J) c‐Met from 20 random fields per mouse. Results are expressed as mean ± SD, n = 8 per group. *, p < .05 versus ND‐CTL group; #, p < .05 versus HFD‐CTL group. Abbreviations: BM‐MSC, bone marrow‐derived mesenchymal stem cell; CTL, normal saline vehicle control; ELISA, enzyme‐linked immunosorbent assay; HFD, high‐fat diet; HGF, hepatocyte growth factor; iPS‐MSC, induced pluripotent stem cell‐derived mesenchymal stem cell; IOD, integrated optical density; MSCs, mesenchymal stem cells; ND, normal diet.
