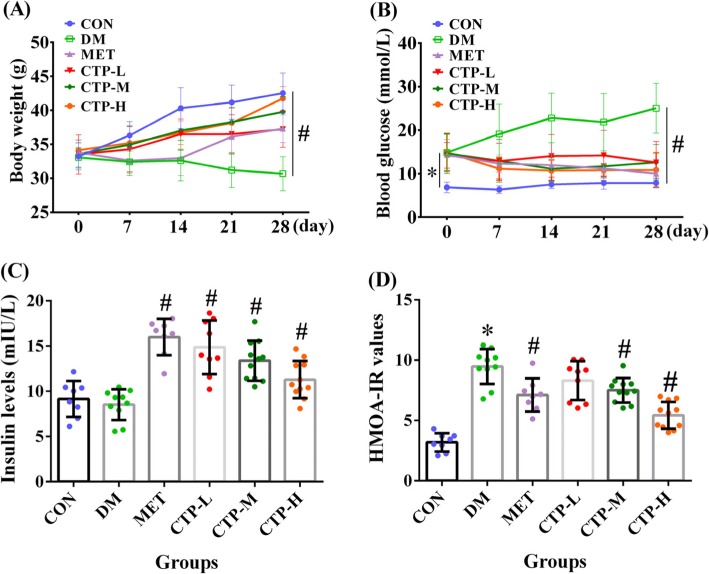
Fig. 2.
Effects of CTP on body weight, FBG, insulin level, and HOMA-IR value in STZ-induced diabetic mice. a Body weight was measured at regular intervals after CTP treatment. b FBG level was measured at regular intervals after CTP treatment. c Insulin level was measured 28 days after CTP was administered. d HOMA-IR value was estimated 28 days after CTP was administered. Data are presented as mean ± SD (n = 8–12). * p < 0.05 as compared with the normal control group (CON). # p < 0.05 as compared with DM

