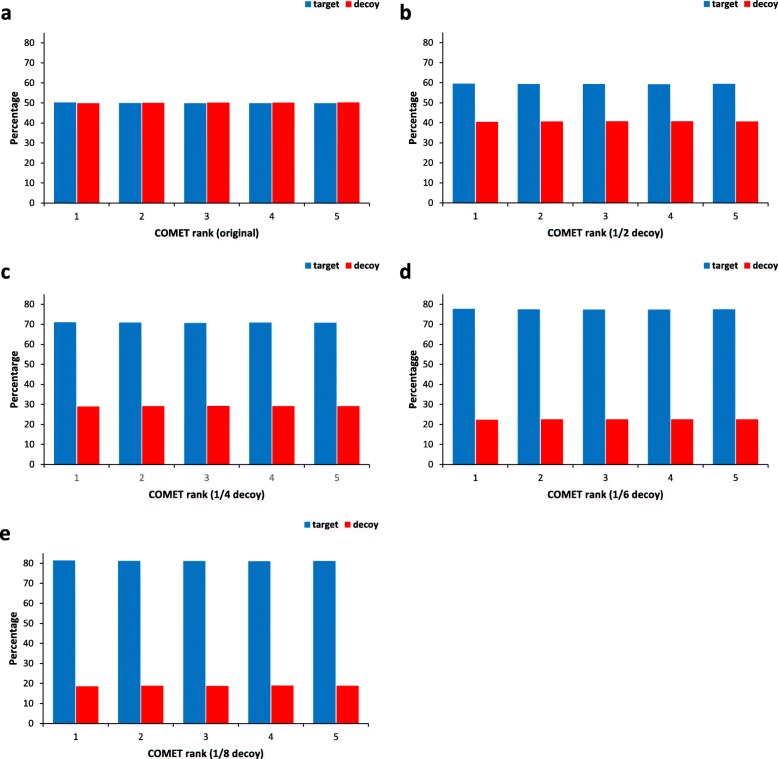
Fig. 4.
The percentages of target/decoy PSMs among the ranks 1–5 PSMs in the Comet results using shifted HEK293 data. Blue bars represent the percentage of target PSMs and red bars represent that of decoy PSMs. (a) Original decoy database; (b) 1/2 decoy database; (c) 1/4 decoy database; (d) 1/6 decoy database; (e) 1/8 decoy database. Using the UniProt database

