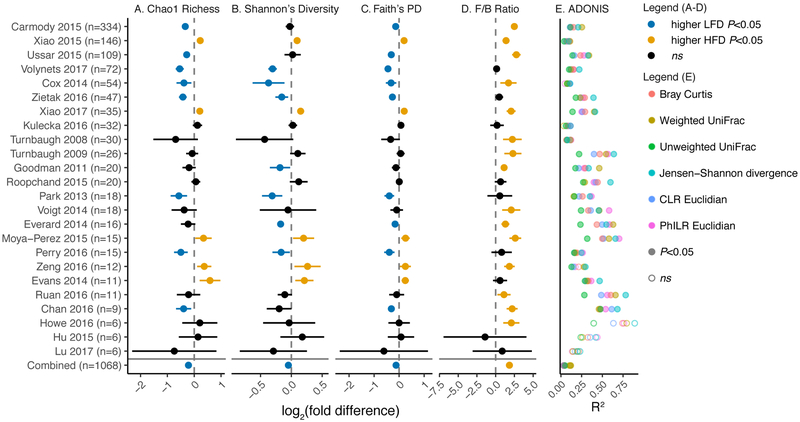
Figure 2. Forest plot of commonly described community metrics in murine studies.
Measures of alpha diversity including (A) Chao1 richness, (B) Shannon's diversity, and (C) Faith's phylogenetic diversity demonstrate inconsistent effects of diet between studies. (D) The ratio of the Firmicutes phylum to the Bacteroidetes phylum is a consistent feature of the HFD. Points represent mean and 95% confidence interval (panels A-D, individual studies computed by Welch's t-test and combined by linear mixed effects model with study as random effect). Anhe 2015 was excluded from plotting due to n=2/group. (E) ADONIS tests of various distance metrics demonstrates consistent within-study effects on community composition as measured by the % variation explained (R2) by diet classification (Combined with study as stratum).

