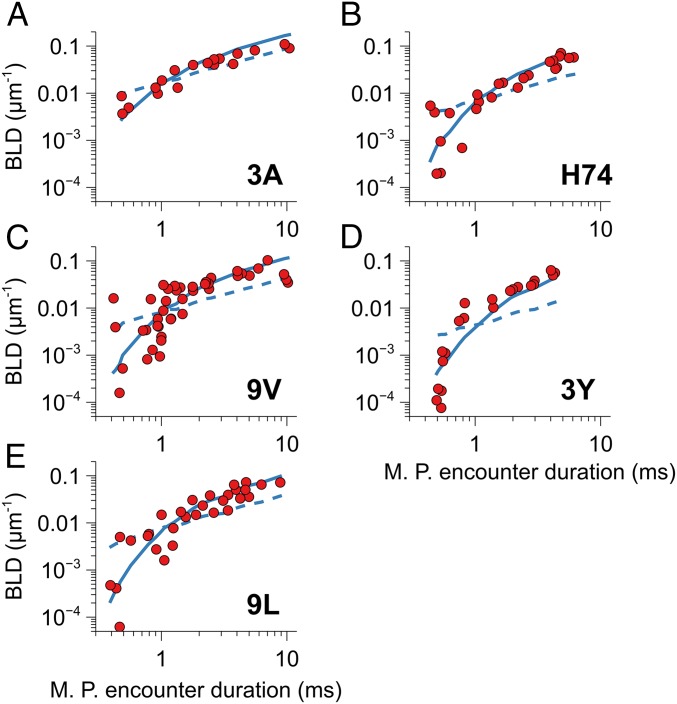
Fig. 3.
Binding linear density (BLD) of each experiment plotted versus most probable encounter duration (red dots) for each pMHC (A–E). Most probable (MP) encounter duration De was calculated as De = L/Vavg, where L = 35 nm is the molecular length of the bond, including intermediate antibodies, and Vavg is the peak of the microspheres’ velocity distribution. Data fits for 2 bond models are shown: The dashed lines show the fit with the classical kon model, while the full lines show the fit with the minimal encounter duration model (ton model).

