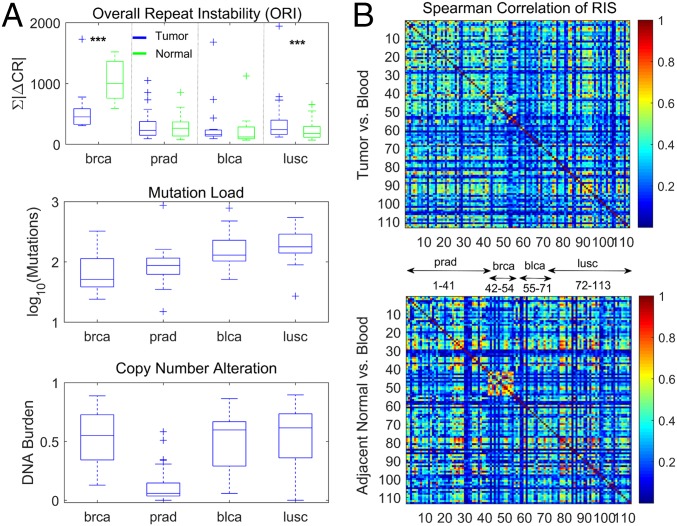
Fig. 5.
Pancancer analysis of repeat instability in the TCGA datasets. (A) The ORI (ORI = ∑|∆CR|; vs. blood) in tumors and corresponding adjacent matched normal tissues (Top; few outliers with ORI > 2,000 are omitted for clarity) (SI Appendix, Fig. S17). The mutation load estimated by number of nonsilent point mutations (Middle) and the copy number alterations (i.e., DNA burden) measured by the fraction of altered genes (gain or loss) in the proteome (Bottom). An inverse relationship exists between repeat instability and point mutation load. In low-mutational load cancer types, repeat instability is larger in the adjacent normal tissues than in tumors, but this reverses in high-mutational load cancers. ***KS test P value < 0.01. (B) Spearman correlation among patients of tumor RISs (RIS = |∆CR|; Upper) and of adjacent matched normal signatures (Lower) measured relative to the blood sample in each patient.

