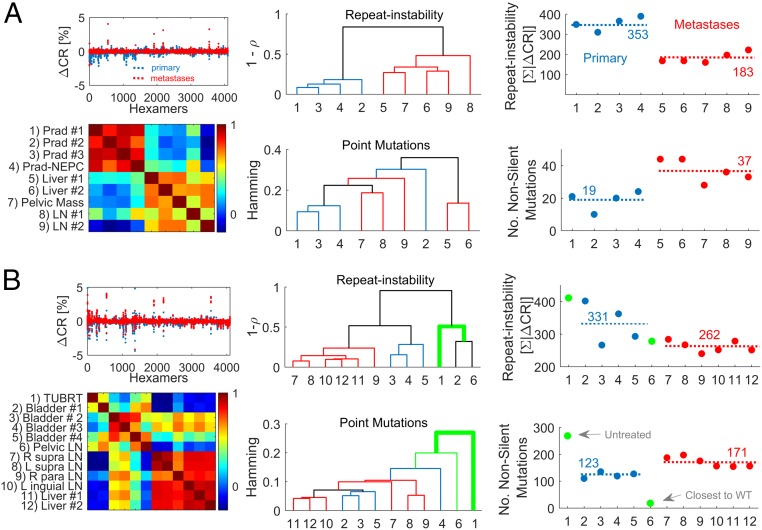
Fig. 6.
Analysis of multiple samples from 2 individuals with metastatic spread. (A) Analysis of a prostate cancer patient with large metastatic spread and multiple available biopsies from ref. 24. (Left) The RISs (RIS = ∆CR) of primary tumor samples (blue) and metastases (red) vs. blood are superimposed (Top), and the heat map of the pairwise Spearman correlations across samples (Bottom) is shown. (Center) The dendrogram inferred by the correlations distance (1 − ρ) among the RIS of samples (Top) and the dendrogram inferred by the hamming distance between the nonsilent point mutation of samples across genes (Bottom). Dendrograms are estimated using UPGMA. Primary tumor leaves are colored in blue, metastatic leaves are in red, and connecting branches are in black. Sample numbers are as in the heat map. (Right) The inverse relationship between the ORI (ORI = ∑|∆CR|; Top) and the nonsilent point mutation load (Bottom). Average values are depicted by dashed lines. Sample numbers are as in the heat map. Prad, prostate adenocarcinoma; NEPC, neuroendocrine prostate cancer; LN, lymph node. (B) Similar analysis of a bladder cancer patient with the largest metastatic spread from ref. 25. Untreated sample (1) and a treated metastatic sample (pelvic), which is the closest to the tumor ancestor wild type (6), are colored in green and are not considered to estimate averages of repeat instability and mutation load (dashed lines in Right) of the treated samples. TUBRT, transurethral resection of bladder tumor; L, left; R, right.

