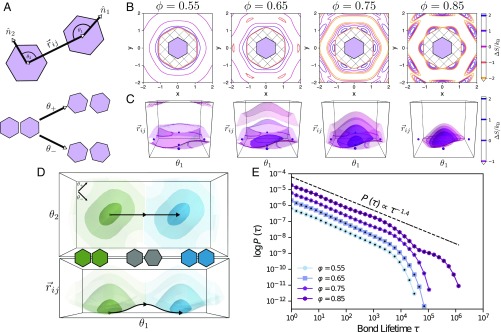
Fig. 2.
(A, Top) Schematic of a pair of regular hexagons, describing the coordinate system for directional entropic forces in 2D systems: . is the angle between the orientation of particle and the interparticle vector (and vice versa for ). This coordinate system distinguishes between pair orientations integrated over in the coordinate system. (A, Bottom) Schematic illustrating alternate coordinates for particle orientation associated with particle libration: and . accounts for shearing motion, and accounts for twisting motion. (B) Contour plots of the entropy in the coordinate system at 4 different densities: . At low density , there is very little attraction or repulsion between hexagons. As density increases, regions of effective attraction and repulsion begin to develop as evidenced by the dark purple “ring” around the geometrically forbidden ring that aligns with the edges of the hexagon, showing that these edges are effectively attractive, while the rings that develop further out correspond to low-entropy configurations that are not favorable and are effectively repulsive. Once in the solid phase , these regions of attraction and repulsion (high-entropy regions and low-entropy regions) are more distinct. (C) Contour plots of the entropy in the coordinate systems at 4 different densities: . In both B and C, the color bar indicates constant contours corresponding to isosurfaces; negative entropy indicates that such configurations are unfavorable, while positive entropy indicates favorable configurations of particle pairs. (D) Schematic of an entropic bonding transition from a view of the plane (Top) and the plane (Bottom) at a density of . Different entropic bonds are indicated by color, while the darker shade indicates a higher entropy, with the shades being at the same isosurfaces shown in C. A proposed reaction coordinate is provided, showing a possible pathway particles may take to reconfigure from one bond configuration to another. (E) Bond lifetime distribution for hard regular hexagons at 4 densities , corresponding to low-density fluid, high-density fluid, low-density solid, and high-density solid phases, respectively. Each data series is shifted by a decade for visual clarity. For each dataset, statistical error calculated from four independent samples is smaller than plot markers. The line added above the data shows the power-law decay behavior of entropic bonds at short times.

