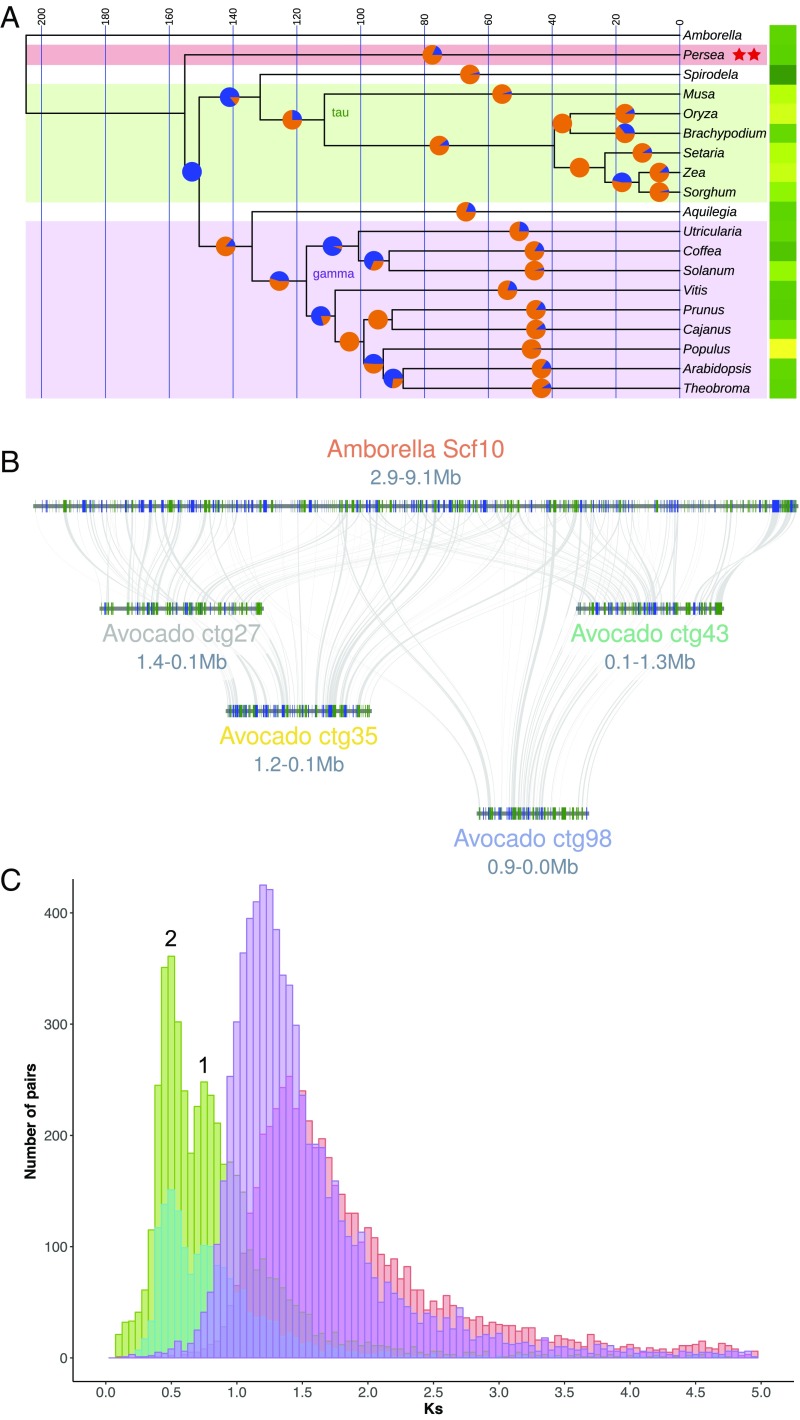
Fig. 3.
Phylogenomic and whole-genome duplication history of avocado. (A) An ultrametric time tree based on universally present single-copy protein sequences depicts 1 of 3 common resolutions of Persea (Magnoliidae) relationships to other flowering plants. This topology, showing avocado sister to monocots plus eudicots, mirrors phylogenetic relationships derived from syntenic distances. Here, the split time between the last common ancestor of avocado and the monocot/eudicot crown group is less than 4 million y. Pie charts at 50% positions on branches show proportions of gene gains (orange) versus losses (blue) as determined by BadiRate’s birth–death–innovation model. Yellow–green (greater–lesser) heat map to the right of the tree depicts relative numbers of genes in the modern genomes. Syntenic analysis revealed 2 independent WGD events (red stars) during avocado’s evolutionary history. (B) Hass avocado (bottom 4 genomic blocks) shows 4:1 intercalated syntenic relationships with Amborella (upper block). (C) Syntenic homologs in avocado show a bimodal Ks distribution suggestive of 2 polyploidy events (numbered 1 and 2; cyan: Hass:Hass paralogs; green: Hass:drymifolia homologs) following the split between magnoliids and Amborella (red syntenic homologs). These events postdate the species split between Vitis and avocado (purple syntenic homologs) and so are independent of the gamma triplication that underlies Vitis.

