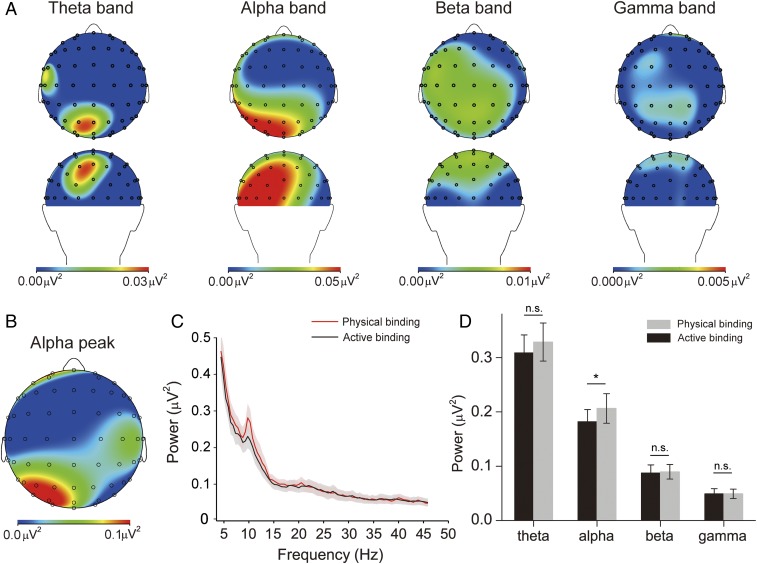
Fig. 2.
EEG results. (A) Group-averaged brain topographies of power differences in different bands from top and back views. From left to right are topographies in the θ- (4 to 7 Hz), α- (7 to 14 Hz), β- (14 to 30 Hz), and γ- (30 to 60 Hz) bands. (B) Group-averaged brain topography of the α-peak power difference. (C) Group-averaged FFT power spectra for the physical binding state (light gray line) and the active binding state (dark gray line). The shaded areas represent 1 SEM calculated across subjects. (D) Group-averaged powers in the θ-, α-, β-, and γ-bands for the 2 binding states. Error bars represent 1 SEM calculated across subjects; n.s., not significant; *P < 0.05.

