Fig. 1.
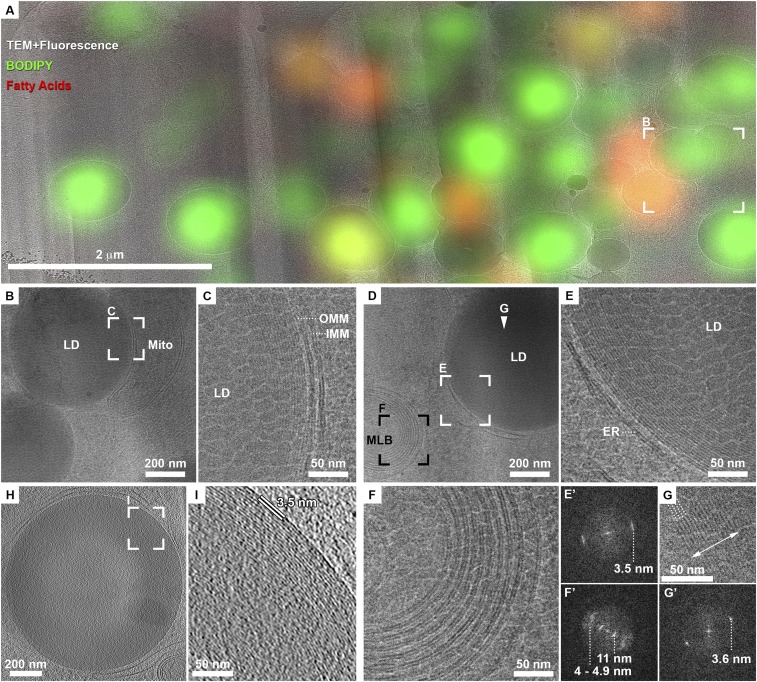
LDs exhibit an internal structure of concentric rings in mitotically arrested cells. (A) Overlay of cryo-TEM montage of FIB lamella with a computer-generated oblique slice through a confocal fluorescence microscopy volume (enlarged from yellow frame in SI Appendix, Fig. S2G.) Green, general neutral lipid dye. Red, fatty acids dye. LDs stained in green or red are distinguishable within the lamella. (B) Enlarged view of frame in A shows two dense LDs in close proximity to a mitochondrion (mito). (C) Enlarged view of frame in B shows on the right the two membranes of the mitochondrion (inner, IMM and outer, OMM), each consisting of a lipid bilayer. The lipid droplet on the left shows a layered structure at its periphery. Granulation observed in the image is due to surface sputter coating with platinum aimed at increasing the conductivity of lamellae for imaging with electrons. (D) Zoom-in of blue frame in SI Appendix, Fig. S2H shows an LD delineated by ER-membranes and a multilamellar body (MLB). (E) LD is enlarged: the periphery of the LD exhibits a layered organization. A Fourier transform of the image in E' exhibits a single peak of 3.5 nm. (F) Enlarged view of MLB in D shows membrane bilayers. A Fourier transform of the image in F' exhibits several peaks, prominently 4 to 4.9 nm of the lipid bilayer spacing and that of 11 nm corresponding to the space between the membranes. (G) Enlarged view of the center of LD in D (white arrowhead) shows a crystalline lattice (four lattice lines are marked with dotted lines) within a ∼50-nm domain (double-sided arrow delineates the width of the domain). A Fourier transform of the image in G' exhibits a single sharp peak of 3.6 nm. (H) Tomographic slice from a different FIB lamella showing a dense LD delineated by ER membranes. (I) Enlarged view of frame in H shows the layered structure at the periphery of the LD. Spacing between layers is directly measured to be 3.5 nm.

