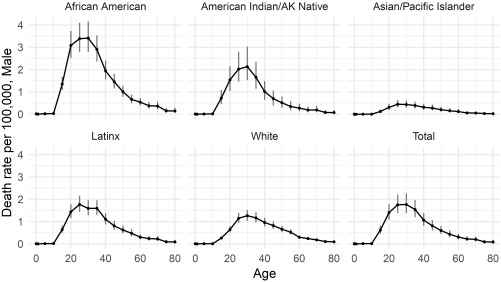
Fig. 3.
Age-specific risk of being killed by the police in the United States by sex and race–ethnicity at 2013 to 2018 risk levels, men and boys. Dashes indicate 90% posterior predictive uncertainty intervals. Life tables were calculated using model simulations from 2013 to 2018 Fatal Encounters data and 2017 National Vital Statistics System data.

