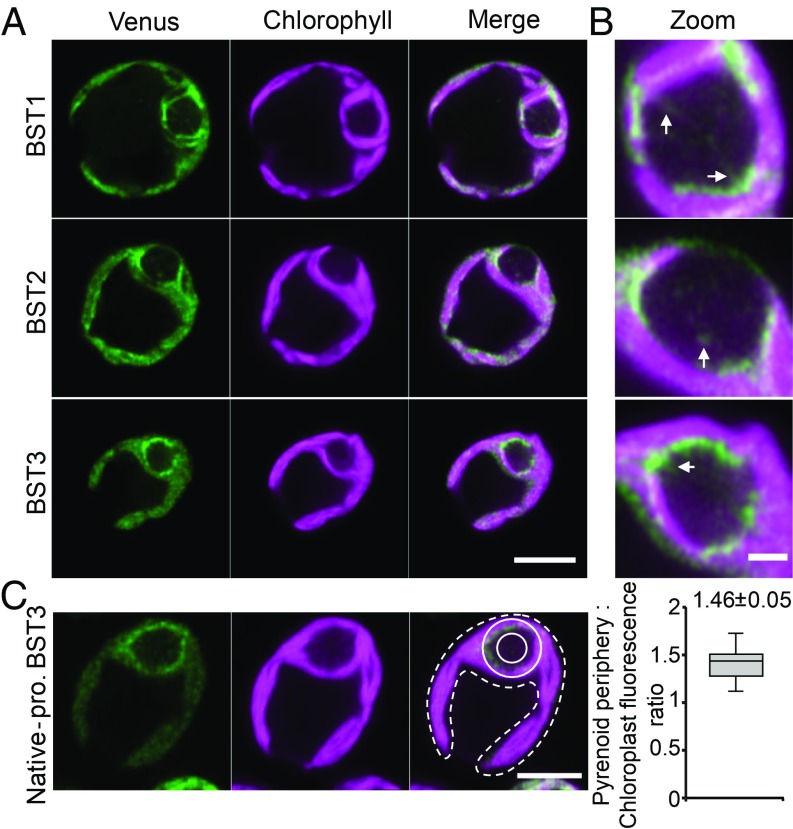
Fig. 3.
Localization of BST1–3. (A) Confocal microscopy of BST1–3 proteins fused with Venus (green) and driven by the constitutive PSAD promoter. Chlorophyll autofluorescence is shown in magenta. (Scale bar, 5 μm.) (B) Zoomed-in images of BST1–3 pyrenoids shown in A. Arrows highlight where Venus fluorescence is seen overlapping with chlorophyll fluorescence in the pyrenoid matrix. (Scale bar, 1 μm.) (C) Localization and quantification of BST3 distribution under its native promoter. The ratio of fluorescence intensity at the pyrenoid periphery (solid line region) and chloroplast (dotted line region) was quantified. The value above the plot denotes the mean ± SE (n = 23). (Scale bar, 4 μm.)

