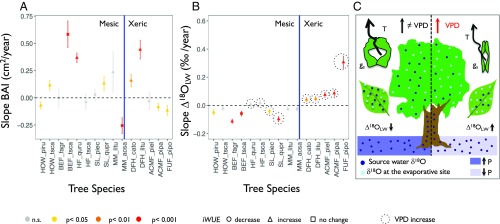
Fig. 3.
Changes in BAI and Δ18OLW, and physiological link between Δ18OLW and gs. Slopes (±SE) of the temporal changes in BAI (A) and Δ18OLW (B) for the investigated species. Slopes significantly different from zero (SI Appendix, Table S7) are denoted with different colors, according to the P values. The black circle denotes sites where VPD increased. The vertical blue line separates mesic from xeric sites. C summarizes the physiological link between the Δ18OLW and changes in transpiration (T) and gs. The arrows indicate when the slope of Δ18OLW was either greater than or less than zero.

