Fig. 2.
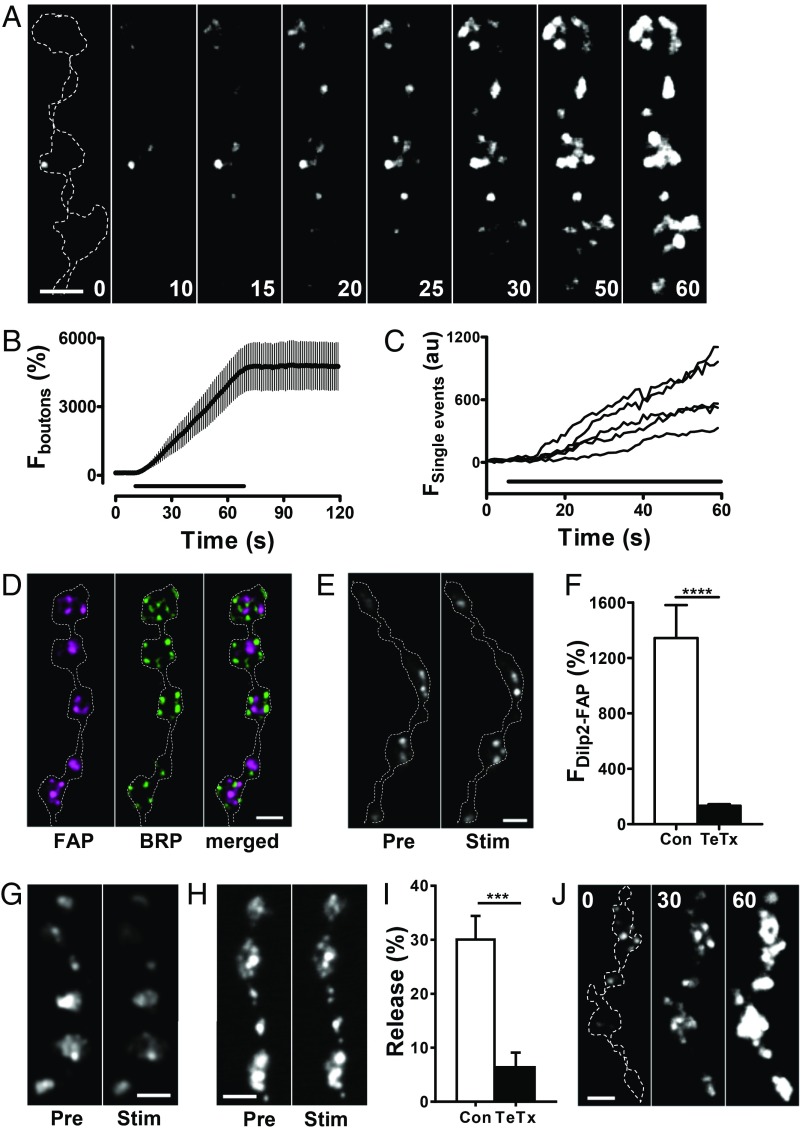
Activity induces opening of DCV fusion pores in synaptic boutons. (A) Contrast-enhanced fluorescent mages of Dilp2-FAP expressing type Is boutons during 30 Hz stimulation for 60 s in the presence of MG-2p. Outline of boutons shown by the dashed line in the first panel. Numbers on the images indicate stimulation time in seconds. A low pass Gaussian blur filter was applied to images for presentation purposes. (B) Time course of bouton fluorescence increase during 30 Hz stimulation for 60 s in the presence of MG-2p. Data are from 4 animals (6 boutons). The bar indicates 30 Hz stimulation. (C) Representative traces of single puncta fluorescence increase during 30 Hz stimulation for 60 s. (D) Pseudocolor images of boutons coexpressing Dilp2-FAP (magenta) and BRP-GFP (green). (E) Representative images of boutons coexpressing Dilp2-FAP and a TeTx light chain before (Pre) and after (Stim) 70 Hz stimulation for 1 min in the presence of MG-2p. (F) Quantification of activity-dependent response in boutons expressing Dilp2-FAP in the control (Con) and boutons coexpressing Dilp2-FAP and TeTx as an increase in MG-2p activated FAP fluorescence in response to 70 Hz stimulation for 1 min. Data are from 6 animals (28 boutons) for each group. ****P < 0.001, unpaired t test. Quantification based on background subtracted unfiltered data. (G) Representative images of Dilp2-GFP expressing boutons before (Pre) and after 70 Hz stimulation for 1 min (Stim). (H) Representative images of boutons coexpressing Dilp2-GFP and TeTx Pre and Stim 70 Hz stimulation. (I) Quantification of activity-induced DCV-mediated release, measured as loss of GFP in the Con and TeTx expressing boutons. Data are from 5 Con animals and 6 TeTx animals. ***P < 0.001, unpaired t test. (J) Contrast-enhanced fluorescence images of Dilp2-FAP expressing boutons during 30 Hz stimulation for 60 s in the presence of MG-2p with Ba2+ instead of Ca2+ in HL3 saline. Outline of boutons shown by the dashed line in the first panel. Numbers on the images indicate stimulation time in seconds. Data are representative of results from 3 animals (Scale bars, 2 µm in all images.)

