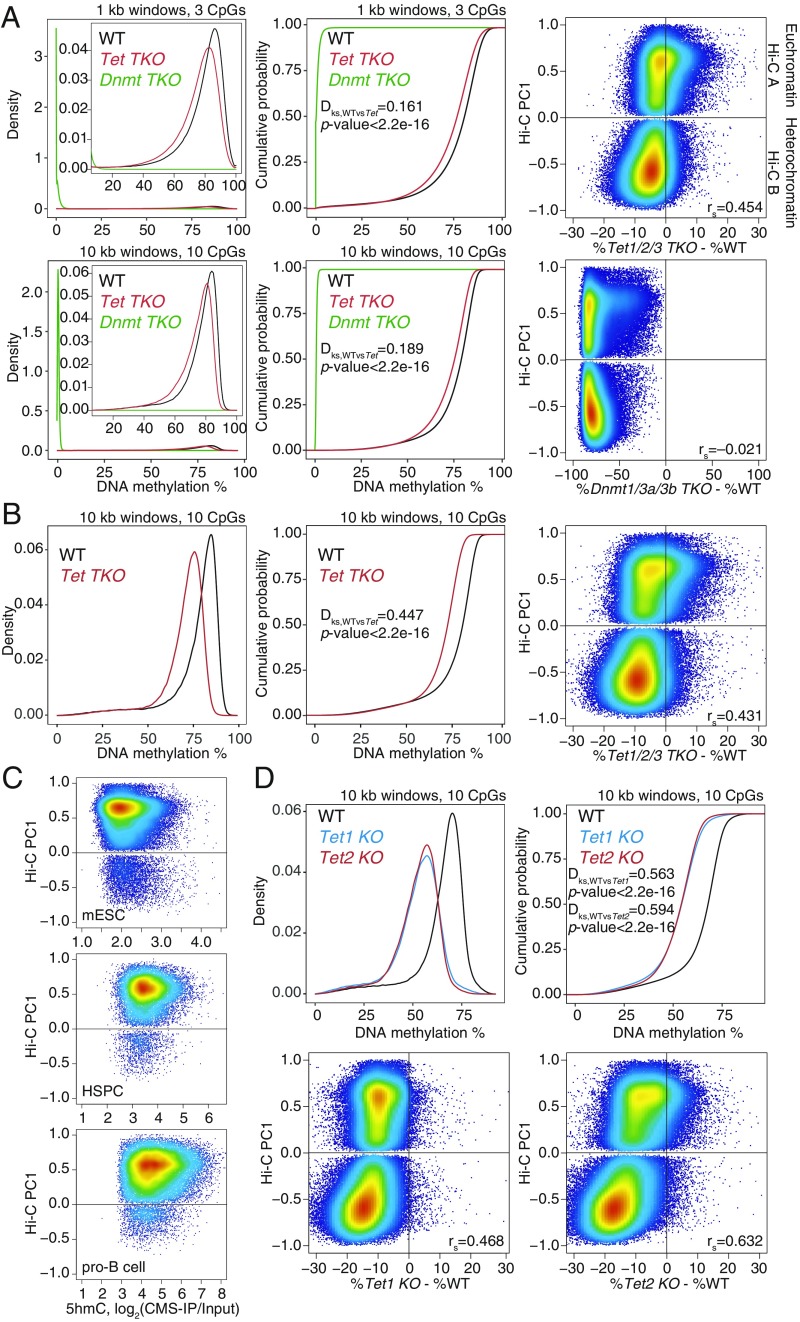
Fig. 1.
Widespread DNA hypomethylation in TET-deficient mouse embryonic stem cells (mESCs). (A) Density distribution (Left) and cumulative distribution (Middle) of average DNA methylation values within 1- and 10-kb windows across the genome in wild-type (WT), Dnmt TKO, and Tet TKO mESCs (data from ref. 25). Only windows with 3 or more CpGs per 1 kb, or 10 or more CpGs per 10 kb, covered by at least 5 WGBS reads per CpG, were considered for the analysis. Two-sample Kolmogorov–Smirnov test comparing the distributions of WT and Tet TKO was used to calculate the Dks statistic and P value. (Right) Correlation between DNA methylation changes (difference in cytosine modification percentage, mutant minus WT) and euchromatin/heterochromatin compartments (positive versus negative Hi-C PC1 values), in Tet TKO (Top) and Dnmt TKO (Bottom) mESCs. Spearman correlation coefficient is shown (rs value). (B) Density distribution (Left) and cumulative distribution (Middle) of average DNA methylation values within 10-kb windows across the genome in WT and Tet TKO mESCs (data from ref. 15). (Right) Correlation between DNA methylation changes and euchromatin/heterochromatin compartments. Spearman correlation coefficient is shown (rs value). (C) Relationship between 5hmC distribution (CMS-IP) and euchromatin/heterochromatin compartments (Hi-C PC1 values) in WT mESCs, HSCs, and pro-B cells. CMS-IP enrichment was calculated for 1-kb windows. (D) Density distribution (Left) and cumulative distribution (Right) of average DNA methylation values within 10-kb windows across the genome, in WT, Tet1 KO, and Tet2 KO mESCs (data from ref. 12). (Bottom) Correlation between DNA methylation changes and euchromatin/heterochromatin compartments. Spearman correlation coefficient is shown (rs value).

