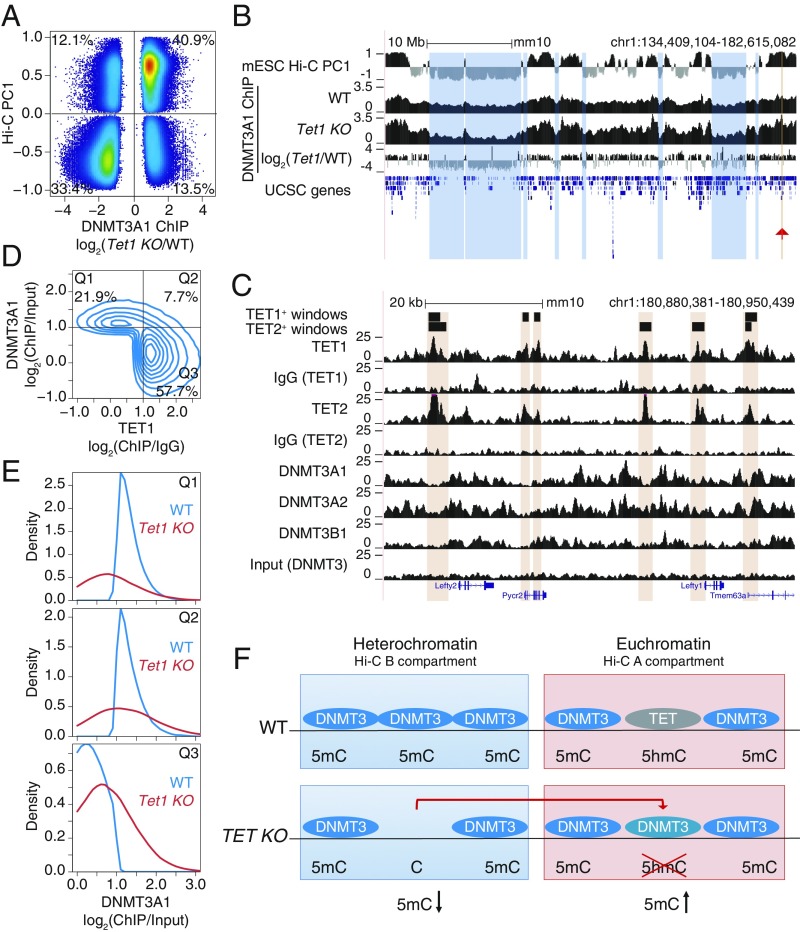
Fig. 7.
Relocalization of DNMT3A away from the heterochromatin compartment of TET-deficient mESCs. (A) Comparison of changes in DNMT3A1 binding in Tet1 KO versus WT mESCs, and euchromatin versus heterochromatin compartments (Hi-C PC1 values) in WT mESCs. Differential binding was calculated at 1-kb windows and displayed are those with a value of P < 0.05. Percentage of windows within each quadrant is indicated. (B) Genome tracks showing a correspondence between the heterochromatic Hi-C B compartment (track 1) and decrease in DNMT3A1 occupancy in Tet1 KO with respect to WT (tracks 2–4). Tracks 2 and 3 show DNMT3A1 occupancy in WT and Tet1 KO mESCs, respectively (shown as reads per kilobase per million reads). Track 4 shows the difference in DNMT3A1 occupancy (visualized as log2 fold-change Tet1 KO/WT). A region containing the Lefty1/2 locus is highlighted by the red arrowhead and is shown in C. (C) Zoomed-in view of the Lefty1/2 locus within the euchromatic compartment. Genome tracks showing mutually exclusive localization of TET1 and TET2 (tracks 1–6) and de novo DNMT proteins (tracks 7–10). (D) Mutually exclusive localization between DNMT3A1 and TET1 binding in the euchromatic Hi-C A compartment in WT mESCs. Percentage of windows within each quadrant is indicated. ChIP-seq enrichment (log2 fold change) was calculated for 1-kb windows. DNMT3A1 data from ref. 53; TET1 data from ref. 54. (E) Distribution of DNMT3A1 occupancy in WT and Tet1 KO mESCs (displayed as enrichment over input) within each of the quadrants defined in D. (F) Schematic model illustrating that loss of TET1 in mESCs results in the relocalization of DNMT3A1, on the one hand from the heterochromatic to the euchromatic compartment as shown in B, and on the other hand to regions within euchromatin that were previously occupied by TET1 as shown in D and E.

