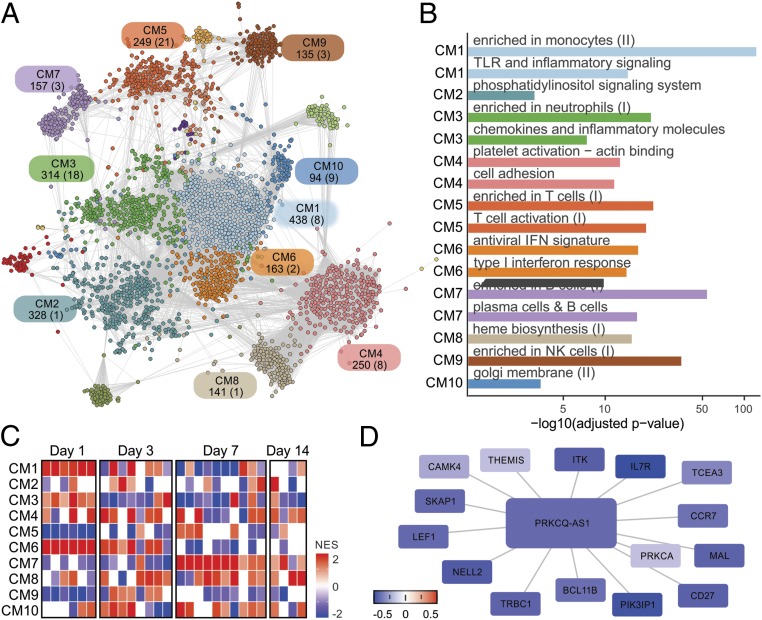
Fig. 4.
Influenza vaccination consensus network. (A) The consensus network was constructed by intersecting CEMiTool results from all IV cohorts and prioritizing frequently detected edges. Inference of communities was performed using a spin glass clustering algorithm. Graph colors are based on community assignment. Each community is represented by a rectangle containing its name and the number of genes and lncRNAs (in parentheses). (B) Overrepresentation analysis of selected communities using blood transcriptional modules (BTMs). False discovery rates (FDR) (x-axis) are plotted for each BTM. (C) Gene set enrichment analysis (GSEA) performed with network communities (rows) and mean fold changes of all vaccinees from each cohort as ranks (columns). Heat map represents normalized enrichment scores (NESs) of communities whose FDR < 0.05. (D) Some PRKCQ-AS1 connections within CM5. The colors of nodes represent log2 fold-change summaries on day 1 relative to baseline.

