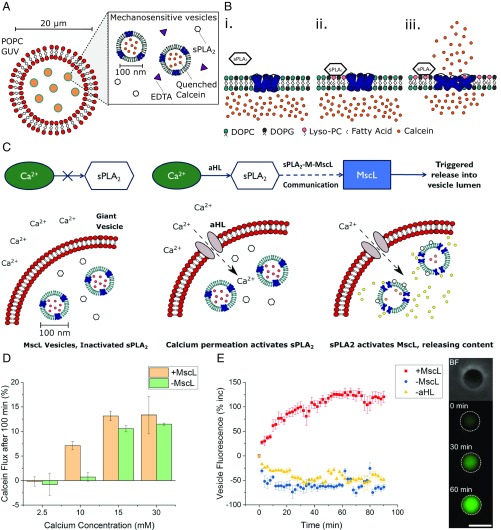
Fig. 1.
Using the sPLA2–M–MscL network to build a synthetic mechanosensitive signaling pathway inside an artificial cell (AC). (A) Composition of the nested AC: A microscale POPC membrane encloses 1:1 DOPC:DOPG vesicles containing reconstituted mechanosensitive channel of large conductance (MscL), secretory phospholipase A2 (sPLA2) enzyme, and EDTA to chelate trace calcium present in the AC. (B) Function of the sPLA2–M–MscL network. (B, i) MscL is reconstituted into a DOPC:DOPG membrane and is closed in the absence of tension or asymmetry in the membrane. sPLA2 is added to the solution. (B, ii) sPLA2 binds to the membrane and begins to catalyze the production of LPC and a concomitant fatty acid. The asymmetric generation of LPC begins to asymmetrically change the pressure profile of the lipid bilayer. (B, iii) Once a critical amount of LPC has been produced, MscL responds to the lateral pressure change by opening to form a 3- to 4-nm diameter pore in the lipid bilayer, releasing encapsulated cargo across the membrane. (C) Proposed functioning of the synthetic mechanosensitive signaling pathway. Ca2+ is prevented from entering the nested vesicle due to the presence of the outer POPC membrane. Permeabilization of the outer membrane (here accomplished with αHL) then results in a calcium influx, activating latent sPLA2 in the vesicle lumen. This activates the sPLA2–M–MscL network, resulting in content release (and potentially the control of downstream events) within the AC. (D) Monitoring activation of the mechanosensitive pathway with fluorescence spectroscopy. Successful activation is triggered by the addition of ∼10 mM Ca2+. Error bars represent 1 SD (n = 3). (E) Confirming activation of the pathway through fluorescence microscopy of individual nested vesicles. (E, Left) Both MscL and αHL are necessary to increase vesicle fluorescence (red squares), while absence of MscL (blue circles) or αHL (yellow triangles) prevents network activation. Error bars represent 1 SEM (n = 15, 14, and 13, respectively). E, Right highlights micrographs of a nested vesicle in bright-field and fluorescence microscopy of pathway activation within the nested vesicle at t = 0, 30, and 60 min, respectively. (Scale bar, 10 μm.)

