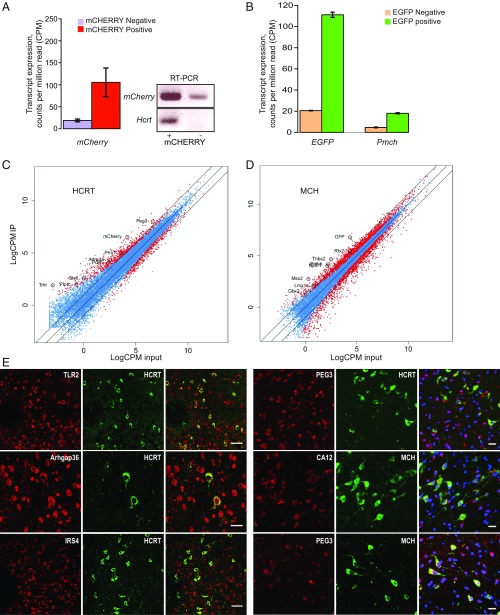
Fig. 3.
Verification of the methods and enrichment for the genes expressed in HCRT and MCH cells. (A) HCRT cell sorting: cells sorted for mCherry fluorescence displayed enrichment for Hcrt transcript (Left). Due to very low expression of the Hcrt gene, we performed PCR to confirm the enrichment of HCRT cells and mCherry+ cells were also positive for Hcrt expression (Right). The results are RNA-seq results and the transcript expression level is displayed as cpm reads. (B) MCH cell sorting: EGFP enriched cells showed enrichment for EGFP and Pmch transcripts. (C and D) Plotting of log counts per million reads (LogCPM) of immunoprecipitation against LogCPM input. Significant DEG genes are highlighted in red and nonsignificant ones in blue (P > 0.05). Outer lines are 2-fold increase/decrease in expression. Some representative genes are marked. (E) Colocalization of candidate genes (red) with HCRT and MCH neuropeptides (green). (Scale bars: Left, 50 μm; Right, 20 μm.)

