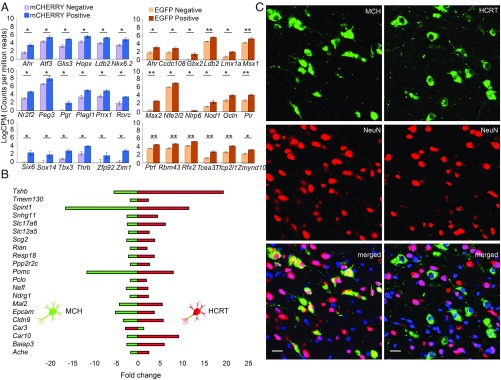
Fig. 4.
Gene sets differentially expressed in HCRT versus MCH cells. (A) TFs enriched in HCRT (Left) and in MCH cells (Right). Positives are pure HCRT and MCH cells and negatives are other hypothalamic cells. Transcript expression is displayed as LogCPM. *P < 0.05; **P < 0.01; n = 3, mean ± SEM. (B) Gene set with opposite direction of expression between HCRT (green) and MCH (red) cell types. The graph shows fold-change in gene expression when HCRT and MCH cells’ transcriptome are compared with the rest of the hypothalamus. (C) Immunostaining for colocalization of hypothalamic HCRT and MCH cells with NeuN neuronal marker. As shown MCH as many other surrounding cells express NeuN while HCRT cells do not. (Scale bars: 20 μm.)

