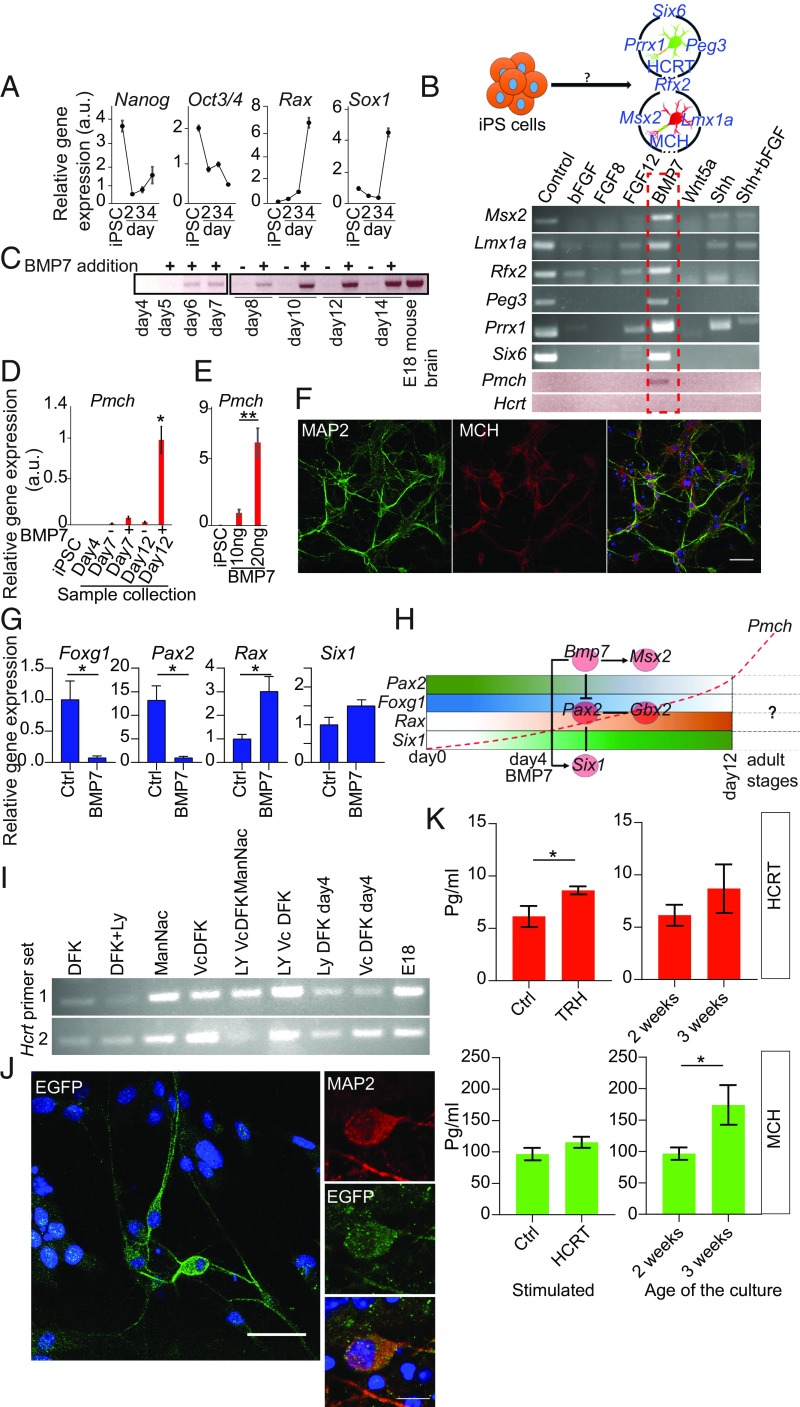
Fig. 6.
Generation of HCRT and MCH neurons from iPSCs. (A) qRT-PCR for pluripotency (Oct3/4, Nanog), hypothalamic (Rax), and early neuroepithelial (Sox1) markers. A large decrease is observed in the expression level of pluripotent markers within 4 d while hypothalamic genes exhibit marked increase. (B, Upper) Schematic figure, which indicates that induction of candidate genes enriched in HCRT and MCH cells, with the help of a specific molecule or condition(?), might induce the expression of Hcrt and Pmch genes. (Lower) RT-PCR for TFs enriched in HCRT and MCH cells in cultures exposed to different signaling molecules and growth factors. iPSCs using protocol in SI Appendix, Fig. S5F were exposed to different molecules with potential role in the hypothalamus development. BMP7 showed strong potential to induce all indicated TFs and also Pmch. (C) The expression pattern of Pmch in the samples with and without BMP7 after different days in culture. Differentiating neurospheres were treated with and without 10 ng/mL BMP7 from day 4. Only in BMP7-treated samples a large expression of Pmch was observed and not in controls. (D) qRT-PCR for Pmch expression. Samples were treated as in C. (E) The effect of different concentrations of BMP7 on expression pattern of Pmch. Results show that the effect of BMP7 on the expression of Pmch is dose-dependent. (F) Neurospheres were kept in differentiation medium for 12 to 14 d before being dissociated and plated on PDL-coated dishes to produce mature neurons. Two weeks after plating the cells were stained for MCH and MAP2 expression. (G) qRT-PCR for representative genes among 30 tested genes downstream of Bmp7. (H) Schematic model of how TFs interact with each other to induce Pmch expression. For details see Discussion. (I) qRT-PCR for Hcrt expression under different differentiation conditions. The same method as for MCH differentiation was used to drive Hcrt expression except that ascorbic acid was used instead of BMP7 from day 3. Ascorbic acid induced Hcrt expression alone and in combination with other tested molecules (SI Appendix, Table S5). Due to short RNA sequence of the Hcrt gene, 2 different primer sets were used. (J) Hcrt-eGFP iPSC-derived, ascorbic acid-treated hypothalamic cells were stained for EGFP and MAP2 expression. (K) Two weeks after plating the neurospheres, differentiated HCRT and MCH cells were stimulated with TRH for HCRT and HCRT-1 for MCH cells for 3 h and the medium were collected to measure secreted molecules in the medium. Bar graphs show ELISA results for secretion analysis of HCRT and MCH neuropeptides. *P = 0.04 for HCRT and P = 0.039 for MCH; **P < 0.01; n = 3, mean ± SEM, t test. For D, E, G, and K: *P < 0.05; **P < 0.01. Scale bars: F and J, Left, 50 μm; J, Right, 10 μm.)

