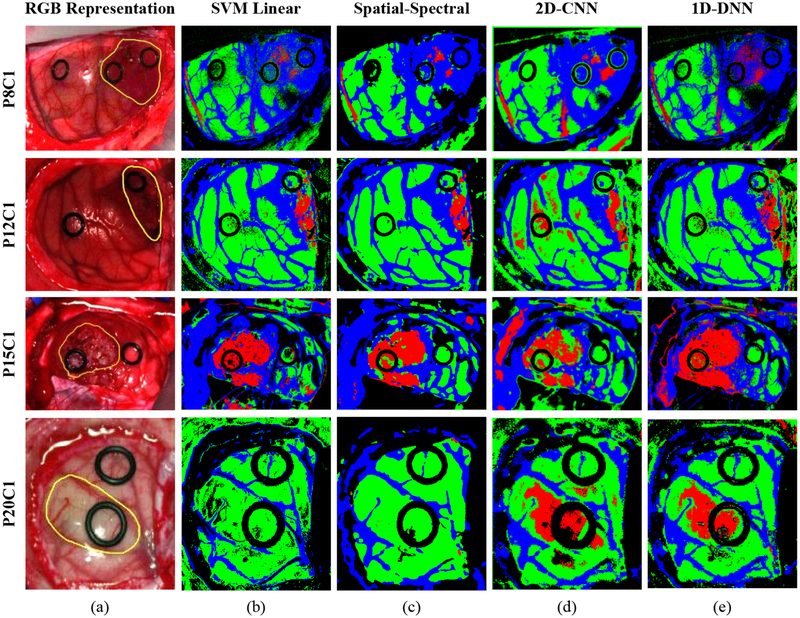
Figure 4.
Multiclass classification results obtained with four images of four different patients of the validation database. (a) Synthetic RGB image of each patient with the tumor area surrounded by a yellow line. (b), (c), (d) and (e) Multiclass classification maps obtained with the SVM, Spatial-Spectral, 2D-CNN and the 1D-DNN, respectively. Normal, tumor and hypervascularized tissue are represented in green, red and blue colors, respectively, while the background is represented in black color.

