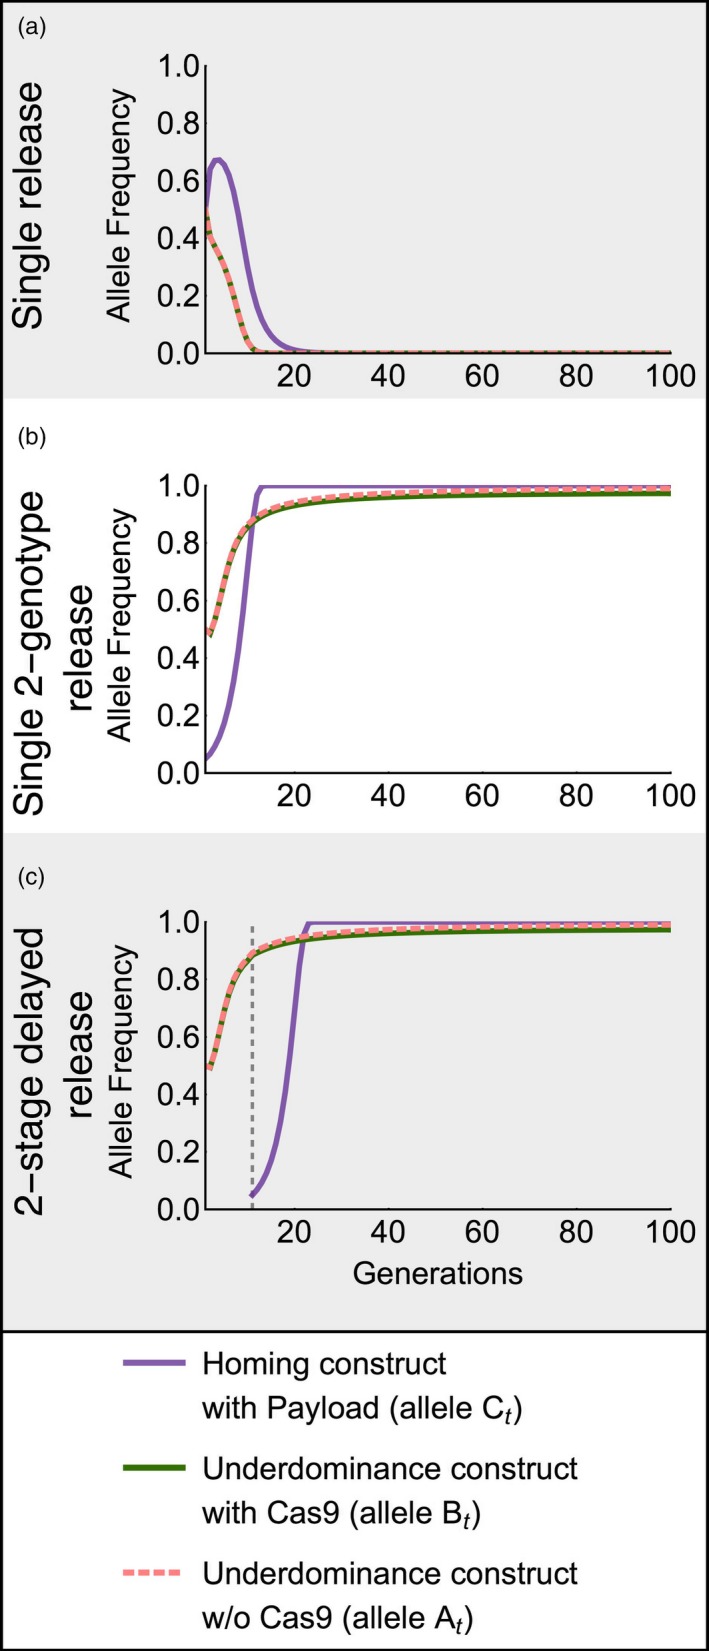
Figure 2.

Time‐series of different release methods for the UTH drive is shown, after a release of engineered individuals at a 1:1 ratio to wild‐type individuals. Homing efficiency, H = 0.95; underdominance construct cost for BtBt homozygotes, s c = 0.05; homozygous payload cost, s p = 0.5
