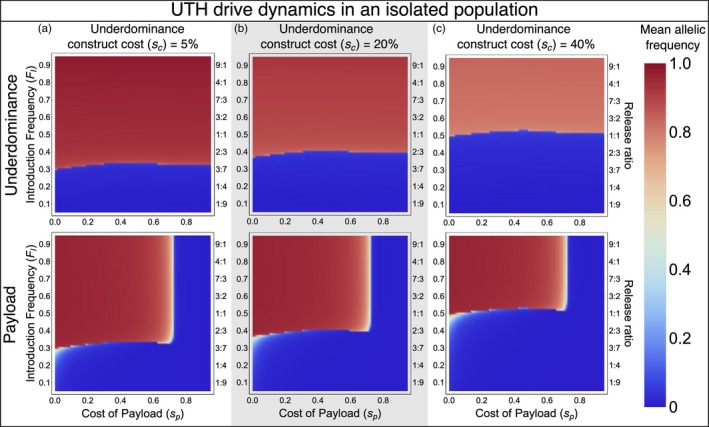
Figure 3.

Underdominance tethered homing (UTH) drive in an isolated population—colors show mean allelic frequencies for one of the underdominance (allele Bt, top row) and the payload gene (bottom row) over a 100‐generation time span following a single release. The three columns show results for UTH drives with different fitness costs of the underdominance component
