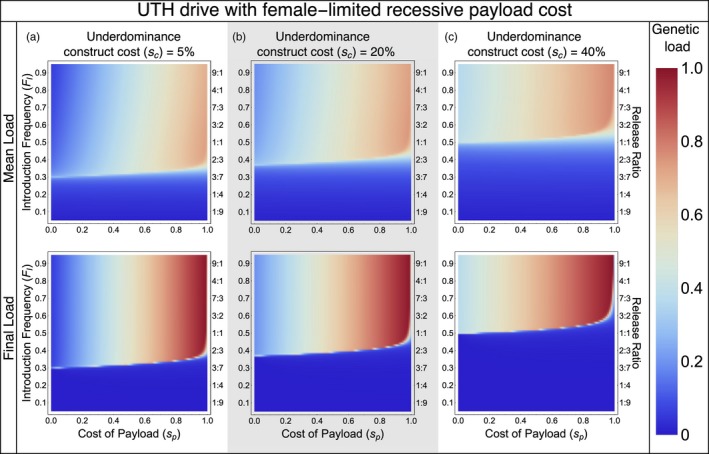
Figure 4.

Colors show mean genetic load over twenty generations after drive release (top row) and final genetic load in the twentieth generation (bottom row)

Colors show mean genetic load over twenty generations after drive release (top row) and final genetic load in the twentieth generation (bottom row)