Figure 5.

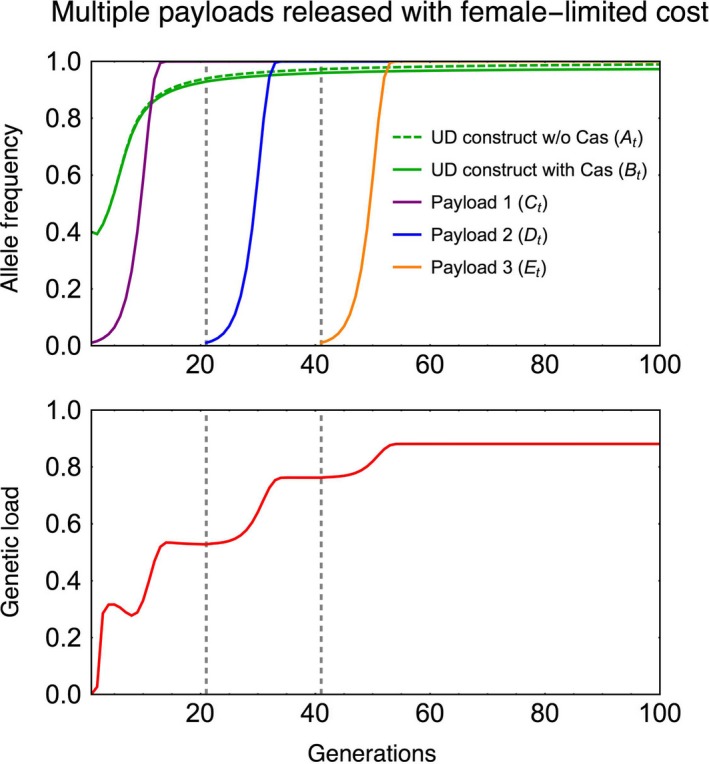
Time‐series plots show frequencies of successively released homing constructs with new payloads (top panel) and the gradual buildup of genetic load in the population with the spread of each new payload gene. The first release has starting frequency of underdominance component at 40% and the first payload at 1%. Each successive payload is released to achieve 1% starting frequency. Each payload gene has a 50% female‐limited homozygous fitness cost. Dashed gray lines show the time of release of successive payloads. Other parameters are s c = 0.05, H = 0.95
