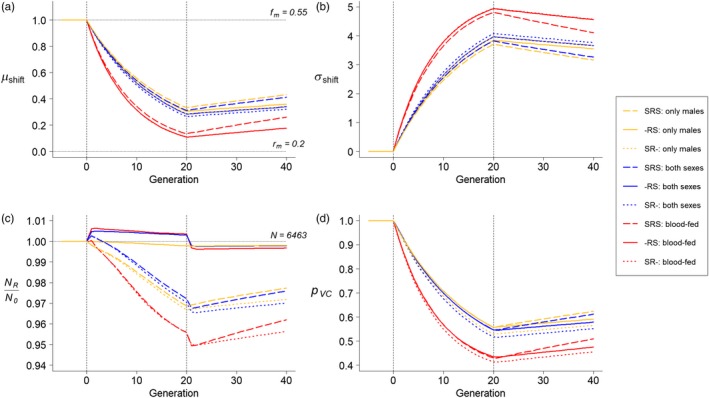
Figure 2.

Change of VC during 20 generations of releases and 20 generations of recovery in the quantitative polygenic model. The model followed the changes of (a) relative mean of VC in the postrelease population (), (b) number of SDs shifted by the VC mean (), (c) ratio of population size between the postrelease and prerelease population (), and (d) the proportion of remaining integrated VC () in the target population. Colors of the lines indicate release strategies: The yellow lines represent releasing only males, the blue lines represent releasing both sexes without blood‐feeding, and the red lines represent releasing prefed females with males. Line types indicate different orders between release and selection: The dashed, solid, and dotted lines represent the “SRS,” “‐RS,” and “SR‐” scenarios, respectively. The first and second dashed vertical lines indicate the start and the end of the releases. Five generations before the release started are also shown to demonstrate the equilibrium state of the prerelease population. The horizontal lines in (a) indicate the selection optimum (f m) and the mean VC of the release population (r m). The horizontal line in (c) indicates the size of the prerelease population. We model all scenarios using the default parameter values in Table 1. Note that the vertical axes do not start from 0 in panels (c) and (d)
