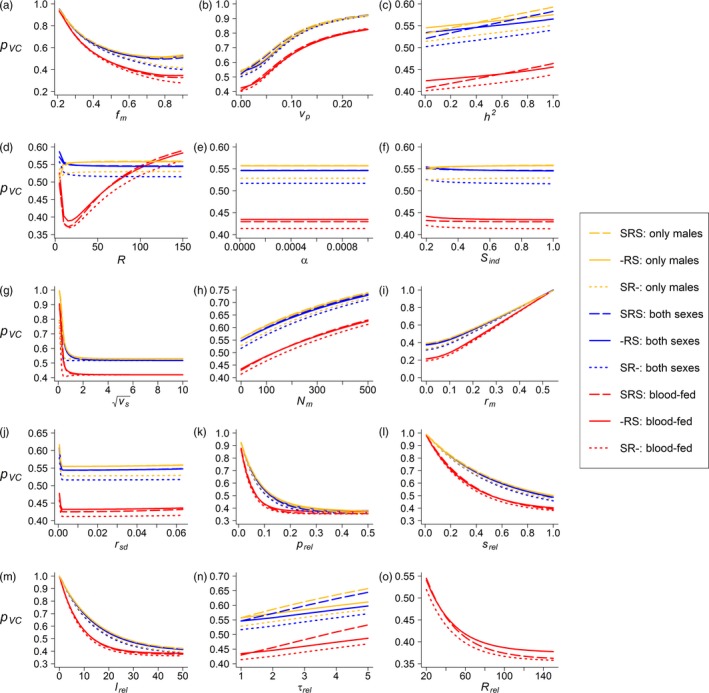
Figure 5.

Local sensitivity analysis of the remaining proportion of integrated VC after releases () to each parameter given all other parameters at their default values (see Table 1 for default values and ranges). Selection variance (v s) was square‐root‐transformed. Note the difference in the y‐axis values across plots. Line types and colors are as in Figure 2
