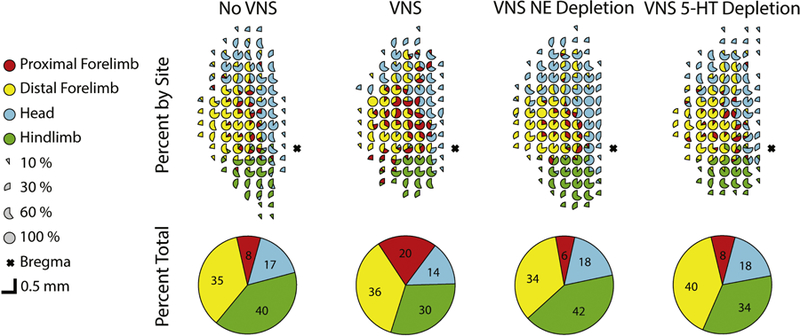
Figure 3. Composite ICMS map of each experimental group.

Percentage of rats with each response type reported at every electrode site. The top row represents percentage of responses by site. The bottom row represents total representation in motor cortex. Colors denote evoked movement categories. Incomplete or absent circles indicate non-responsive sites. The VNS-control group has additional proximal forelimb responses throughout motor cortex. Gross topography of primary motor cortex remains unchanged across groups.
