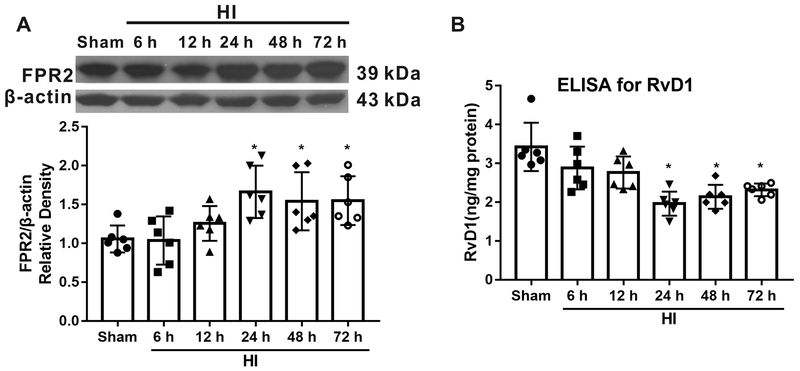
Fig. 1.
Time course expression of FPR2 and RvD1 post hypoxia-ischemia (HI). (A) Representative Western blot bands and schematic diagram showed that FPR2 levels increased after HI, reaching significance from 24 h to 72 h. (B) RvD1 was decreased after HI. ANOVA followed by Tukey test was used for analysis. Data are presented as mean ± SD, n=6. * P<0.05 vs. sham. RvD1, resolvin D1.

