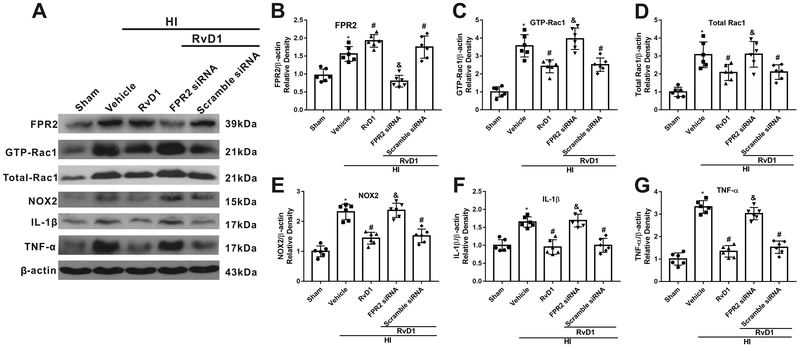
Fig. 6.
Knockdown of FPR2 reduced the anti-inflammation effect of RvD1 at 24 h post hypoxia-ischemia (HI). (A) Representative Western blot bands. (B-G) Quantification of Western blot bands showed that RvD1 significantly increased the expression of FPR2 (B), whereas decreased the expression of GTP-Rac1 (C), total Rac1(D), NOX2(E), IL-1β (F), and TNF-α(G) compared with HI+vehicle group. However, FPR2 siRNA reversed the effect of RvD1 compared with HI+RvD1+scramble siRNA group. ANOVA followed by Tukey test was used for analysis. Data were shown as mean ± SD (n=6 per group). * P < 0.05 vs. sham group; # P < 0.05 vs. HI+vehicle group; & P < 0.05 vs. HI+RvD1+scramble siRNA group. RvD1, resolvin D1.

