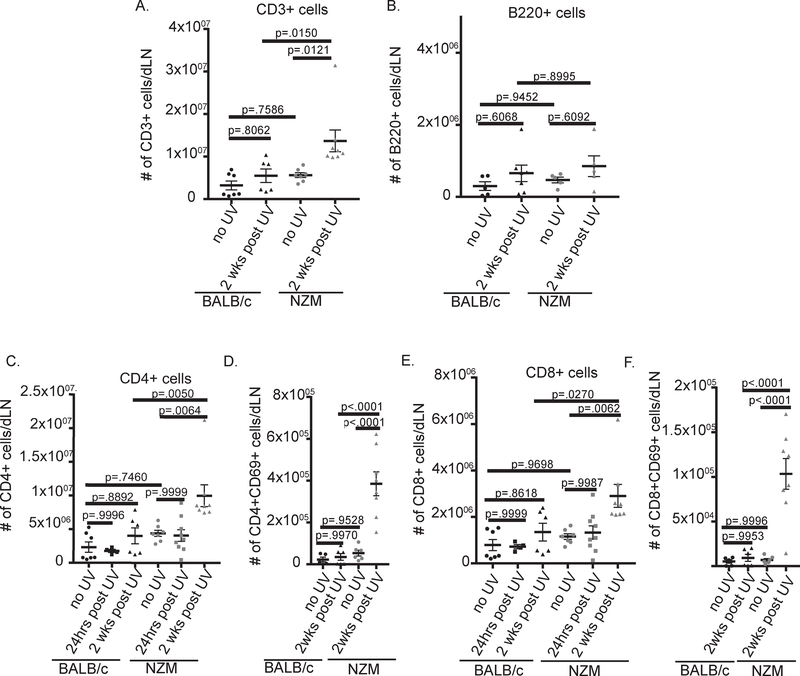
Figure 2:
Lupus-prone mice have increased T cell activation in dLN 2 weeks post UVB treatment compared to wild-type mice. Changes in immune cell populations in the dLN were evaluated by flow cytometry 24hrs and 2 weeks post UVB treatment. (A) Total T cells per dLN: CD3+. (B) Total B cells: B220+. (C) CD4+ T cells: CD3+CD4+CD8−. (D) CD4+ T cell activation: CD69+. (E) CD8+ T cells: CD3+CD4−CD8+. (F) CD8+ T cell activation: CD69+. (A-F) Each dot represents an individual mouse. ANOVA testing was used to determine significance.

