
Fig 12: Inflammation-related mRNA levels in LO cells overtime.
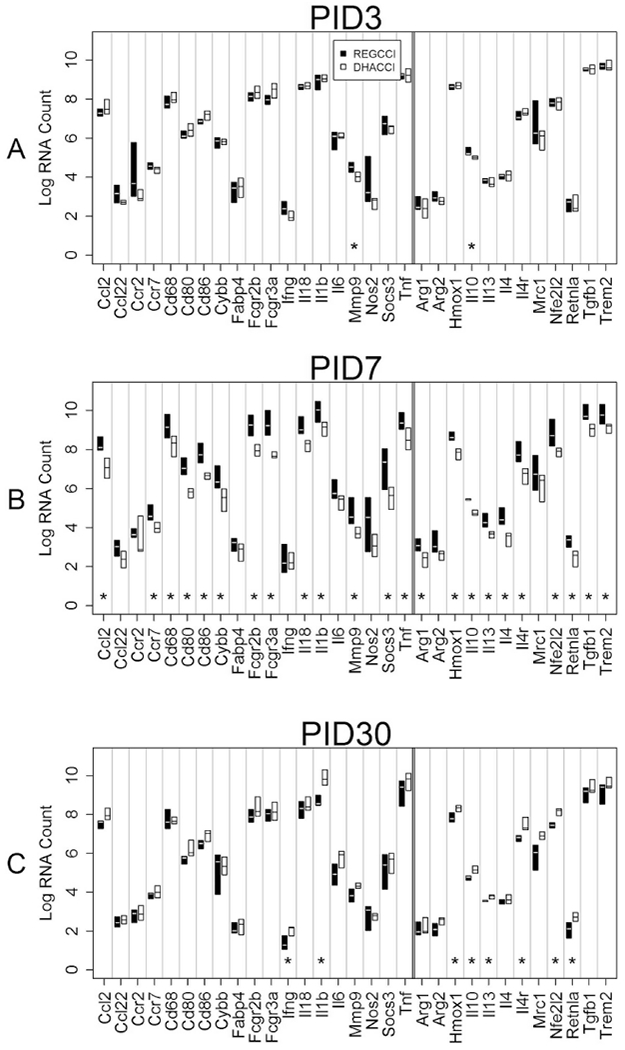
This graph shows median mRNA values, with the upper and lower quartiles for each gene of interest. REGCCI is shown in black and DHACCI in white. We performed statistical analyses using RNA values, but used log conversion for graphical representation to allow fitting a wide range of RNA values on a single y-axis. Asterisks (*) denotes differences between the two CCI groups. A. In LO cells at PID3, pro-inflammatory MMP9 (p=0.006) and anti-inflammatory IL10 mRNA levels (p=0.004) increased in REGCCI, compared to DHACCI. B. At PID7, REGCCI had higher mRNA levels of many pro-inflammatory genes: Ccr7 (p=0.02), Cybb (p=0.02), CcL2 (p=0.003), CD68 (p=0.008), CD80 (p=0.003), CD86 (p=0.001), CD16 (Fcgr2b, p=0.002), CD32 (Fcgr3a, p=0.002), MMP9 (p=0.004), IL-1β(p=0.006), IL-18(p=0.004), TNF α (p=0.005) and Socs3 r(p=0.02) relative to DHACCI. Expression of anti-inflammatory genes also increased in REGCCI: TGF β (0.001), IL10 (p=0.004), IL 13 (p=0.002), IL 4 (p=0.003) IL4r (p=0.001), Nfe2l2 (p=0.005), Retnla (p=0.005) Trem2 (p=0.02) and Hmox1 (p=0.004). C. On PID 30, fewer genes were affected but did so in the opposite direction: DHACCI had higher pro-inflammatory Inf Y (p=0.01) and IL-1 β (p=0.002), and higher anti-inflammatory Hmox1 (p=0.02), Retnla (p=0.02), IL-10 (p=0.005), IL4r (p=0.004), IL13 (p=0.005) and Nfe2l2 (p=0.0009).