
Fig 9: Transcription Factor mRNA levels in LO cells over time.
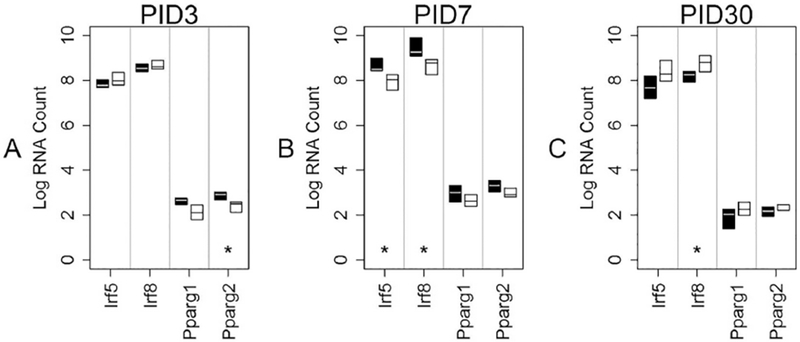
This graph shows median mRNA values, with the upper and lower quartiles for each gene of interest. REGCCI is shown in black and DHACCI in white. We performed statistical analyses using RNA values, but used log conversion for graphical representation to allow fitting a wide range of RNA values on a single y-axis. Asterisks (*) denote differences between the two CCI groups, driven by diet. A. At PID3, REGCCI pparg2 increased relative to DHACCI, p=0.01, but the very low mRNA counts in both groups make the results of unlikely significance. B. In LO cells (microglia-enriched population) at PID7, DHA decreased irf5 and irf8 mRNA relative to REGCCI microglia (p=0.0015 for irf5 and p= p=0.0015 for irf8) C. DHACCI irf 8 increased relative to REGCCI, p=0.01.