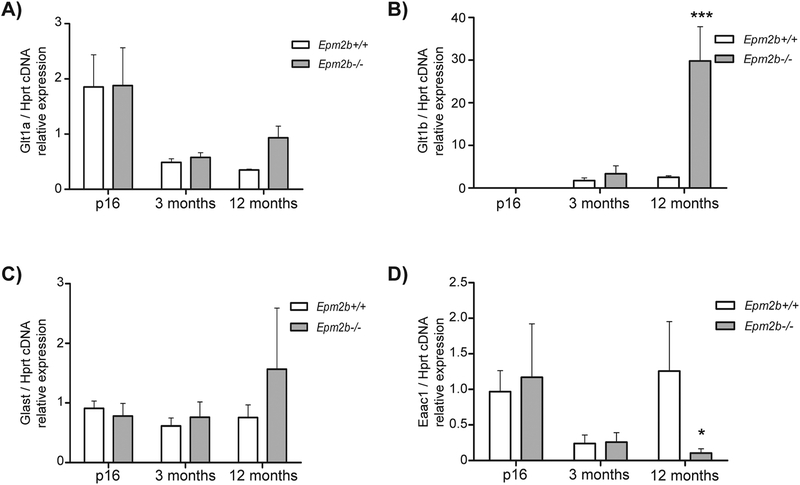
Figure 3. qPCR analysis of Glt-1a, Glt-1b, Glast and Eaac1 in hippocampus of Epm2b+/+ and Epm2b−/− mice.
Glt-1a/Hprt (A), Glt-1b/Hprt (B), Glast/Hprt (C) and Eaac1/Hprt (D) relative cDNA expression levels in Epm2b+/+ and Epm2b−/− animals at p16, 3 months and 12 months of age. In A), no statistical difference was found between groups (two-way ANOVA, Bonferroni test post-hoc, n=3). In B), at 12 months of age, Epm2b−/− mice express more Glt1-b than Epm2b+/+ (p-value ***<0.001, n= 3; two-way ANOVA, Bonferroni test post-hoc). In C), no statistical difference was found between groups (n= 3; two-way ANOVA, Bonferroni test post-hoc). In D), at 12 months of age, Epm2b−/− mice express less Eaac1 than Epm2b+/+ (p-value *<0.05, n= 3; two-way ANOVA, Bonferroni test post-hoc).

